Temporal-Difference Learning
Note: the notations and formalizations follow the previous post Basic Reinforcement Learning
TD Prediction
constant-\(\alpha\) MC:
\[V(s_t) \leftarrow V(s_t)+\alpha\left[R_t - V(s_t) \right]\]Target: \(R_t\) - the actual return following time \(t\)
\(\alpha\) - a constant step-size parameter
Whereas MC methods must wait until the end of the episode to determine the increment to \(V(s_t)\), TD methods need to wait only until the next step
TD(0) or one-step TD:
\[V(s_t) \leftarrow V(s_t)+\alpha \left[r_t + \gamma V(s_{t+1}) - V(s_t) \right]\]Target: \(r_t + \gamma V(s_{t+1})\)
TD error:
\[\delta_t \triangleq r_t + \gamma V(s_{t+1}) - V(s_t)\]The difference between the estimated value of \(s_t\) (\(V(s_t)\)) and the better estimate \(r_t + \gamma V(s_{t+1})\)
Recall in DP:
\[\begin{align*} V_{\pi}(s) &\triangleq \mathbb{E}_{\pi} \left[R_t \mid s_t=s \right] &\text{:Target for MC}\\ &=\mathbb{E}_{\pi} \left[r_t + \gamma V_{\pi}(s_{t+1}) \mid s_t=s \right] &\text{:Target for DP} \end{align*}\]TD target not only samples the expected value but uses the current estimate \(V\) instead of the true \(V_{\pi}\). Thus it combines the sampling of MC with the bootstrapping of DP
SARSA
SARSA is an on-policy TD control method, for an on-policy method we must estimate \(Q_{\pi}(s,a)\) for the current behavior policy \(\pi\) and for all states \(s\) and actions \(a\)
Consider transitions from state-action pair to state-action pair
\[(s_t,a_t),r_t \rightarrow (s_{t+1},a_{t+1}),r_{t+1} \rightarrow (s_{t+2},a_{t+2}),r_{t+2} ...\]The update rule of SARSA:
For nonterminal state \(s_t\):
\[Q(s_t,a_t) \leftarrow Q(s_t,a_t)+\alpha \left[r_t + \gamma Q(s_{t+1},a_{t+1}) - Q(s_t,a_t) \right]\]For terminal state \(s_{t+1}\):
\[Q(s_{t+1},a_{t+1})=0\]TD error:
\[\delta_t \triangleq r_t + \gamma Q(s_{t+1},a_{t+1}) - Q(s_t,a_t)\]The control algorithm (as in all on-policy methods):
-
estimate \(Q_{\pi}\) for the current behavior policy \(\pi\)
-
update \(\pi\) toward greediness w.r.t \(Q_{\pi}\)
SARSA converges with probability 1 to an optimal policy and action-value function as long as all state-action pairs are visited an infinite number of times and the policy converges in the limit to the greedy policy (when using \(\epsilon\)-greedy or \(\epsilon\)-soft policies)
Q-learning
Q-learning is an off-policy TD control method
The update rule:
\[Q(s_t,a_t) \leftarrow Q(s_t,a_t)+\alpha \left[r_t + \gamma \max_b Q(s_{t+1},b) - Q(s_t,a_t) \right]\]where the learned \(Q\) directly approximates the optimal \(Q_*\) independent of the policy being followed
Some insights:
-
Q-learning drammatically simplifies the analysis of the alg and enabled early convergence proofs
-
though the policy has not been evaluated, it still determines which \((s,a)\) pairs are visited and updated
-
the requirement for convergence is that all pairs continue to be updated
On/Off Policy Revisit
In the TD setup,
-
On-policy: evaluate and improve a \(\epsilon\)-greedy policy, where this policy is also used to generate samples (update policy and behavior policy are the same)
-
Off-policy: evaluate and improve a greedy policy, where a \(\epsilon\)-greedy policy is used to generate samples (update policy and behavior policy are different)
In SARSA, the policy evaluation takes place in \(r+\gamma Q(s',a')\), where \(a' \sim \pi(a' \mid s')\) with \(\epsilon\)-greedy
This means, the agent looks ahead to the next action to see what the agent will do at the next step following the current policy. In other words, the \(\epsilon\)-greedy policy with the property of exploration has been evaluated and updated for whether the next state and action will be safe or dangerous
In Q-learning, the policy evaluation takes place in \(r+\gamma \max_{a'} Q(s',a')\), where an absolute greedy policy has been evaluated and updated all the time
Since the Q-function always updates with greedy evaluations without attempting to resolve what that policy actually is, it doesn’t take into account the exploration effects
Some insights:
-
When the policy is simply a greedy one, Q-learning and SARSA will produce the same results
-
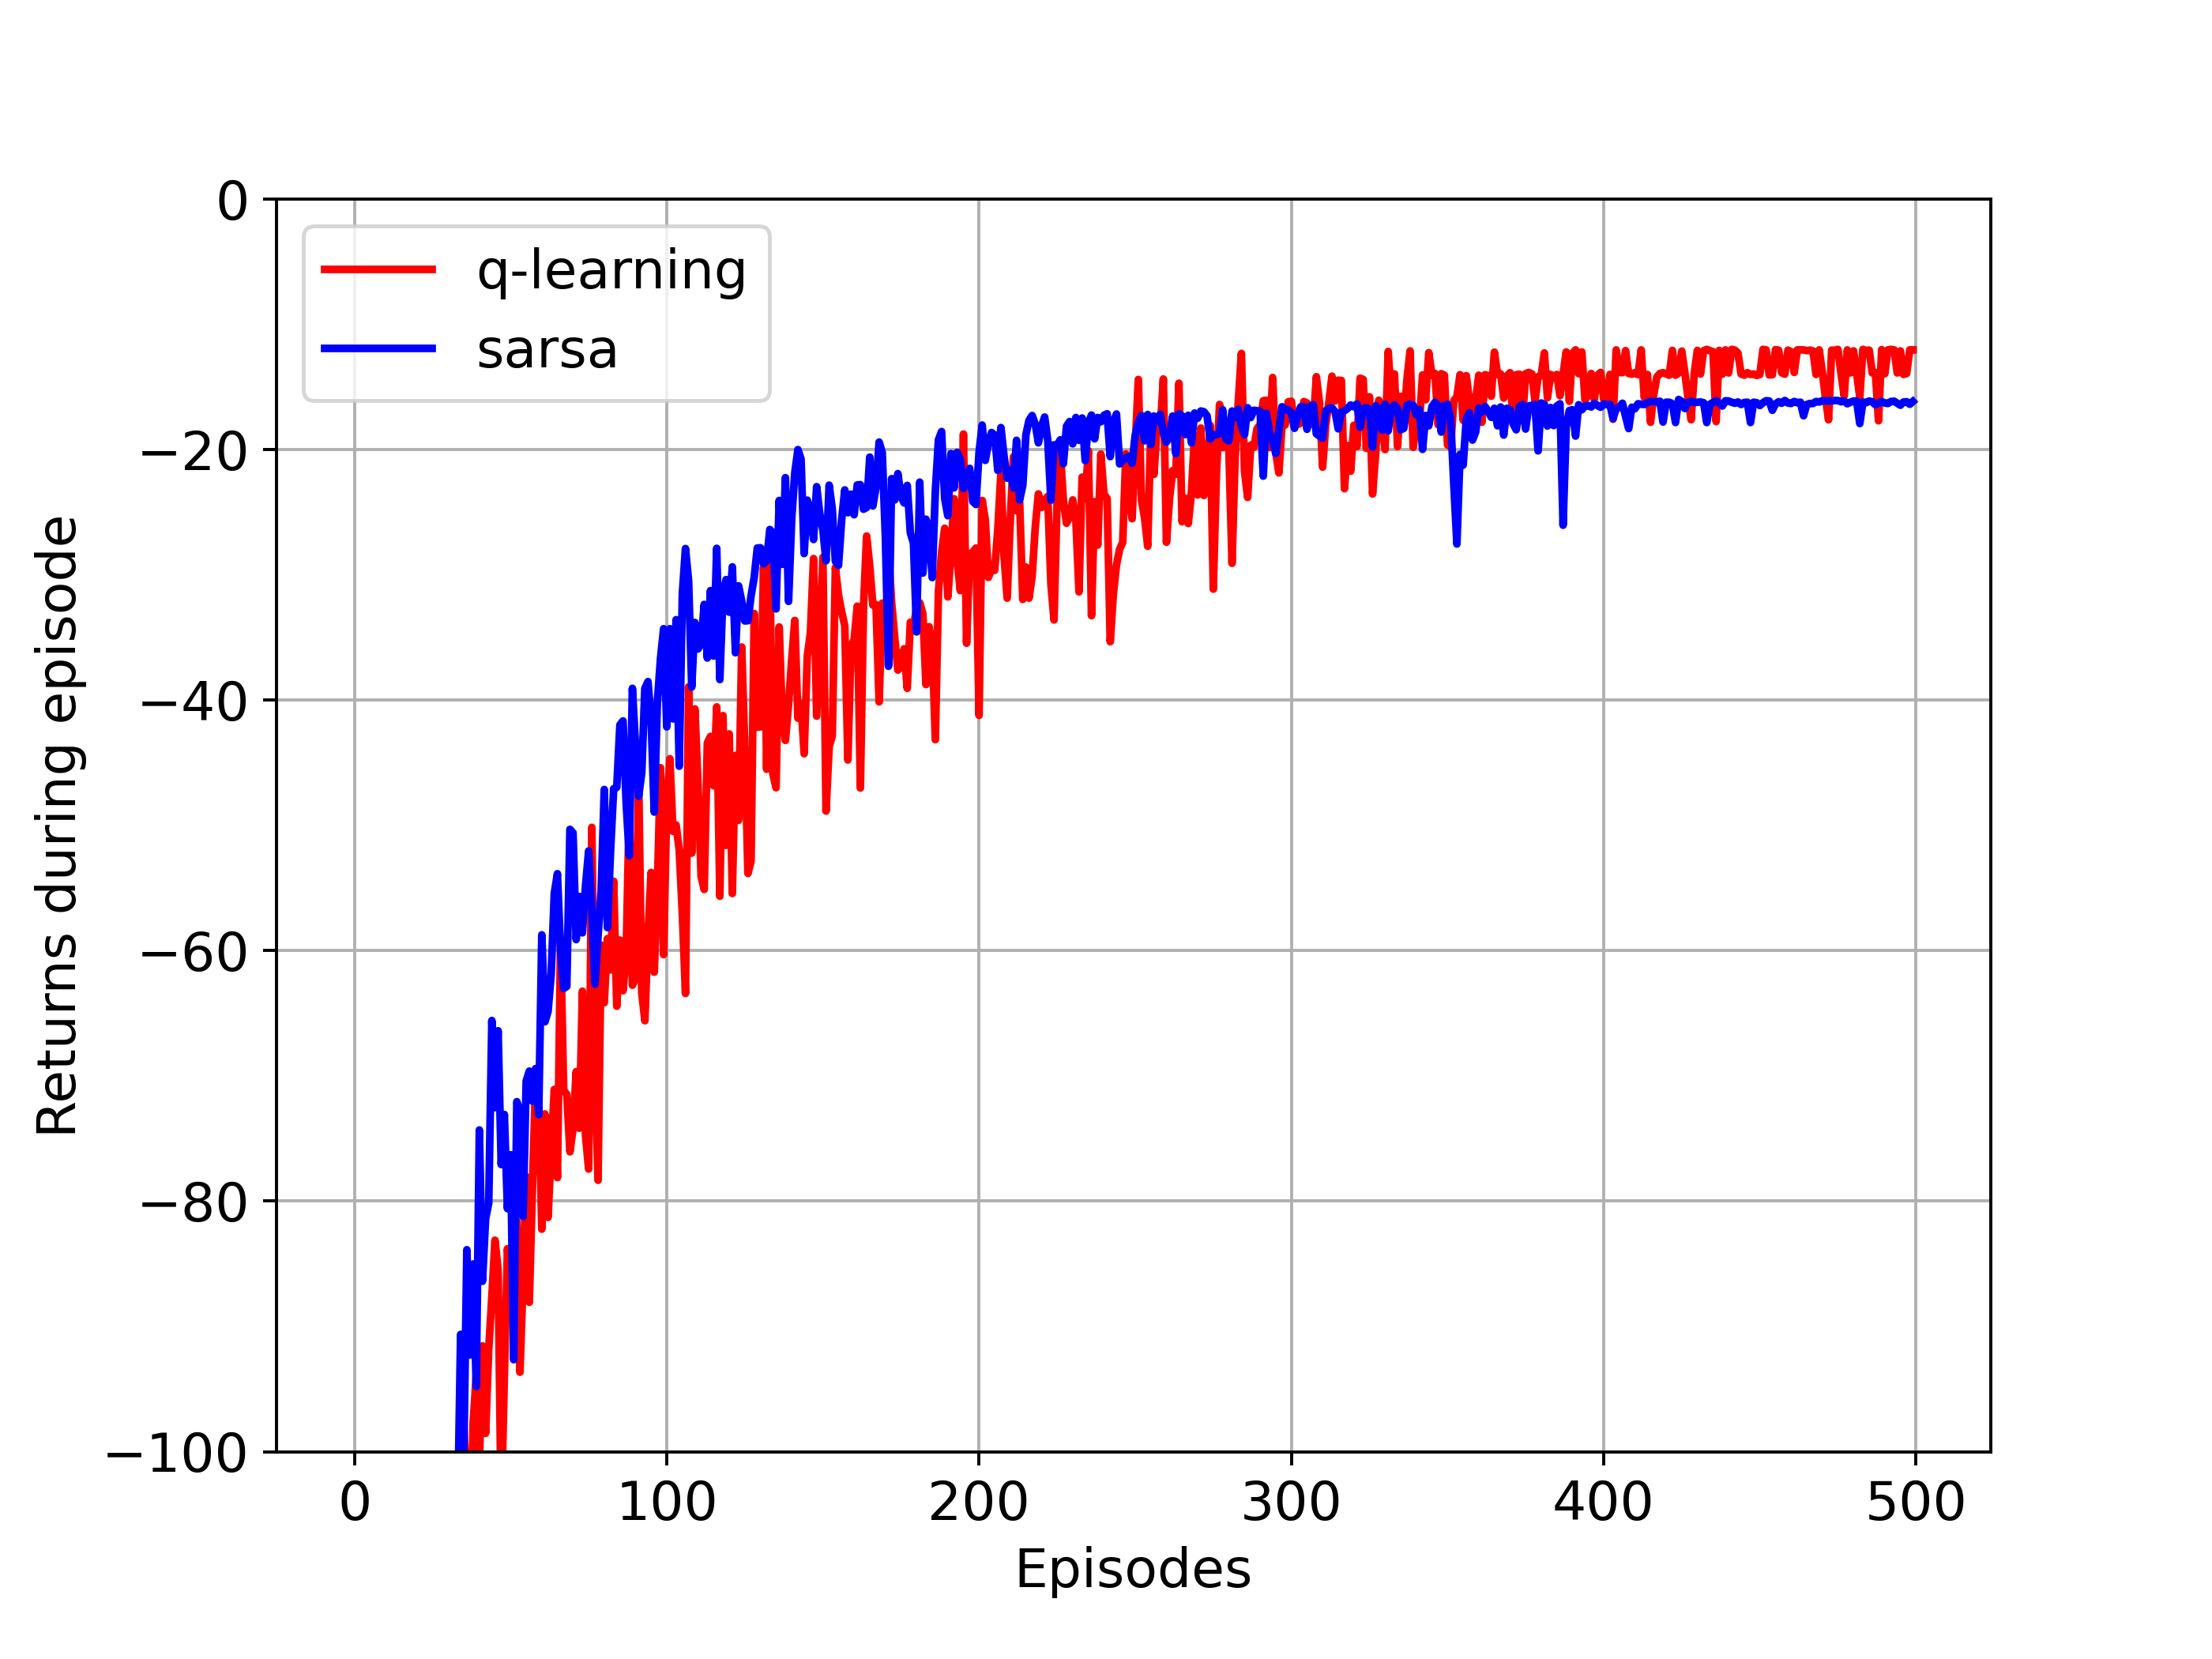
SRASA usually performs better than Q-learning, especially when there is a good chance that the agent will choose to take a random suboptimal action in the next step
-
Q-learning’s assumption that the agent is following the optimal policy maybe far enough from true that SARSA will converge faster and with fewer errors
-
Q-learning is more likely to learn an optimal policy when the agent doesn’t explore too much, where SARSA is less likely to learn such an optimal policy but a safer one
See Cliff Walking for more info
Expected SARSA
The update rule:
\[Q(s_t,a_t) \leftarrow Q(s_t,a_t)+\alpha \left[r_t + \gamma \mathbb{E}_{\pi} \left[Q(s_{t+1},a_{t+1}) \mid s_{t+1} \right] - Q(s_t,a_t) \right]\] \[Q(s_t,a_t) \leftarrow Q(s_t,a_t)+\alpha \left[r_t + \gamma \sum_a \pi(a \mid s_{t+1}) Q(s_{t+1},a) - Q(s_t,a_t) \right]\]Expected SARSA is more complex computationally than SARSA but, in return, it eliminates the variance due to the random selection of \(a_{t+1}\)
Expected SARSA can also do off-policy that it can use a policy different from the target policy to generate behavior
Double Q-learning
A maximum over estimated values can lead to a significant positive bias
Suppose we learn two independent estimates \(Q_1(a), Q_2(a), \forall a \in \mathcal{A}\) of the true value \(Q(a)\), we could use \(Q_1\) to determine the max action \(a^*=\arg \max_a Q_1(a)\)
and use \(Q_2\) to provide the estimate of its value \(Q_2(a^*)=Q_2(\arg \max_a Q_1(a))\)
The estimate will then be unbiased in the sense that \(\mathbb{E}[Q_2(a^*)]=Q(a^*)\), then we repeat the process to yield a second unbiased estimate \(Q_1 (\arg \max_a Q_2(s))\)
The update rule:
\[Q_1(s_t,a_t) \leftarrow Q_1(s_t,a_t)+\alpha \left[r_t + \gamma Q_2(s_{t+1}, \arg \max_a Q_1(s_{t+1},a)) - Q_1(s_t,a_t) \right]\] \[Q_2(s_t,a_t) \leftarrow Q_2(s_t,a_t)+\alpha \left[r_t + \gamma Q_1(s_{t+1}, \arg \max_a Q_2(s_{t+1},a)) - Q_2(s_t,a_t) \right]\]There are also double versions of SARSA and Expected SARSA
See Maximization Bias Example for more info
Important Concepts
Sample updates: involve looking ahead to a sample successor state (or state-action pair), using the value of the successor and the reward along the way to compute a backed-up value and then updating the value of the original state (or state-action pair)
Sample updates differ from the expected updates of DP in that they are based on a single sample successor rather than on a complete distribution of all possible successors
Batch updating: updates are made only after processing each complete batch of training data
Batch MC vs Batch TD: Batch MC always find the estimates that minimize mean-squared error on the training set, whereas batch TD(0) always finds the estimates that would be exactly correct for the maximum-likelihood model of the Markov process
Maximum-likelihood Estimate of a parameter is the parameter value whose probability of generating the data is greatest
Batch TD(0) converges to the certainty-equivalence estimate, which means it assumes that the estimate of the underlying process was known with certainty rather than being approximated
Maximization Bias: the maximum of the true values is zero, but the maximum of the estimates is positive, a positive bias
Random Walk

deterministic dynamics: p(s'|s,a)=1

states={0,1(A),2(B),3(C),4(D),5(E),6}
actions={left,right}, sample uniformly

termination: state 0 and 6
r=+1, at state 6
r=0, otherwise
MC vs TD implementation:
import numpy as np
import matplotlib.pyplot as plt

states=[0,1,2,3,4,5,6]
actions=[-1,1]
V_true=np.arange(1,6)/6.0

def step(s,a):

    s_=s+a

    if s_==0:
        return s_,0,True
    elif s_==6:
        return s_,1,True
    else:
        return s_,0,False

def run_td(n_eps,lr=0.1):

    V=np.ones(len(states))*0.5
    rms=[]
    for ep in range(n_eps):
        s=np.random.choice(states[1:6])

        while True:
            s_old=s
            a=np.random.choice(actions)
            s,r,done=step(s_old,a)
            if done:
                V[s_old]+=lr*(r-V[s_old])
            else:
                V[s_old]+=lr*(r+V[s]-V[s_old])

            if done:
                break

        rms.append(np.sqrt(np.sum(np.power(V_true-V[1:6],2))/5.0))

    return V,rms

v1,rms1=run_td(1)
v10,rms10=run_td(10)
v100,rms100=run_td(100)

plt.figure(figsize=(8,6))
plt.plot(range(1,6),V_true,'-o',label='true')
plt.plot(range(1,6),v1[1:6],'-o',label='1')
plt.plot(range(1,6),v10[1:6],'-o',label='10')
plt.plot(range(1,6),v100[1:6],'-o',label='100')
plt.grid()
plt.xticks(range(1,6),('A','B','C','D','E'),fontsize=15)
plt.yticks(fontsize=15)
plt.legend(fontsize=15)
plt.savefig('td_randomwalk.png',dpi=350)
def run_mc(n_eps,lr):

    V=np.ones(len(states))*0.5
    rms=[]

    for ep in range(n_eps):
        s=np.random.choice(states[1:6])
        traj=[s]

        while True:
            s_old=s
            a=np.random.choice(actions)
            s,r,done=step(s_old,a)
            traj.append(s)

            if done:
                break

        for st in traj:
            V[st]+=lr*(r-V[st])

        rms.append(np.sqrt(np.sum(np.power(V_true-V[1:6],2))/5.0))

    return V,rms

lr_td=[0.15,0.1,0.05]
lr_mc=[0.01,0.02,0.03,0.04]
n_runs=100
ls=['-','--',':','-.']
plt.figure(figsize=(8,6))

for i,lr in enumerate(lr_td):
    rms_all=[]
    for n in range(n_runs):
        _,rms=run_td(n_eps=100,lr=lr)
        rms_all.append(rms)

    plt.plot(np.array(rms_all).mean(axis=0),color='r',label='td'+str(lr),linestyle=ls[i])

for i,lr in enumerate(lr_mc):
    rms_all=[]
    for n in range(n_runs):
        _,rms=run_mc(n_eps=100,lr=lr)
        rms_all.append(rms)

    plt.plot(np.array(rms_all).mean(axis=0),color='b',label='mc'+str(lr),linestyle=ls[i])

plt.legend(loc='upper right',fontsize=13)
plt.grid()
plt.xticks(fontsize=15)
plt.yticks(fontsize=15)
plt.xlabel('episodes',fontsize=15)
plt.ylabel('RMS',fontsize=15)
plt.savefig('td_mc_randomwalk.png',dpi=350)
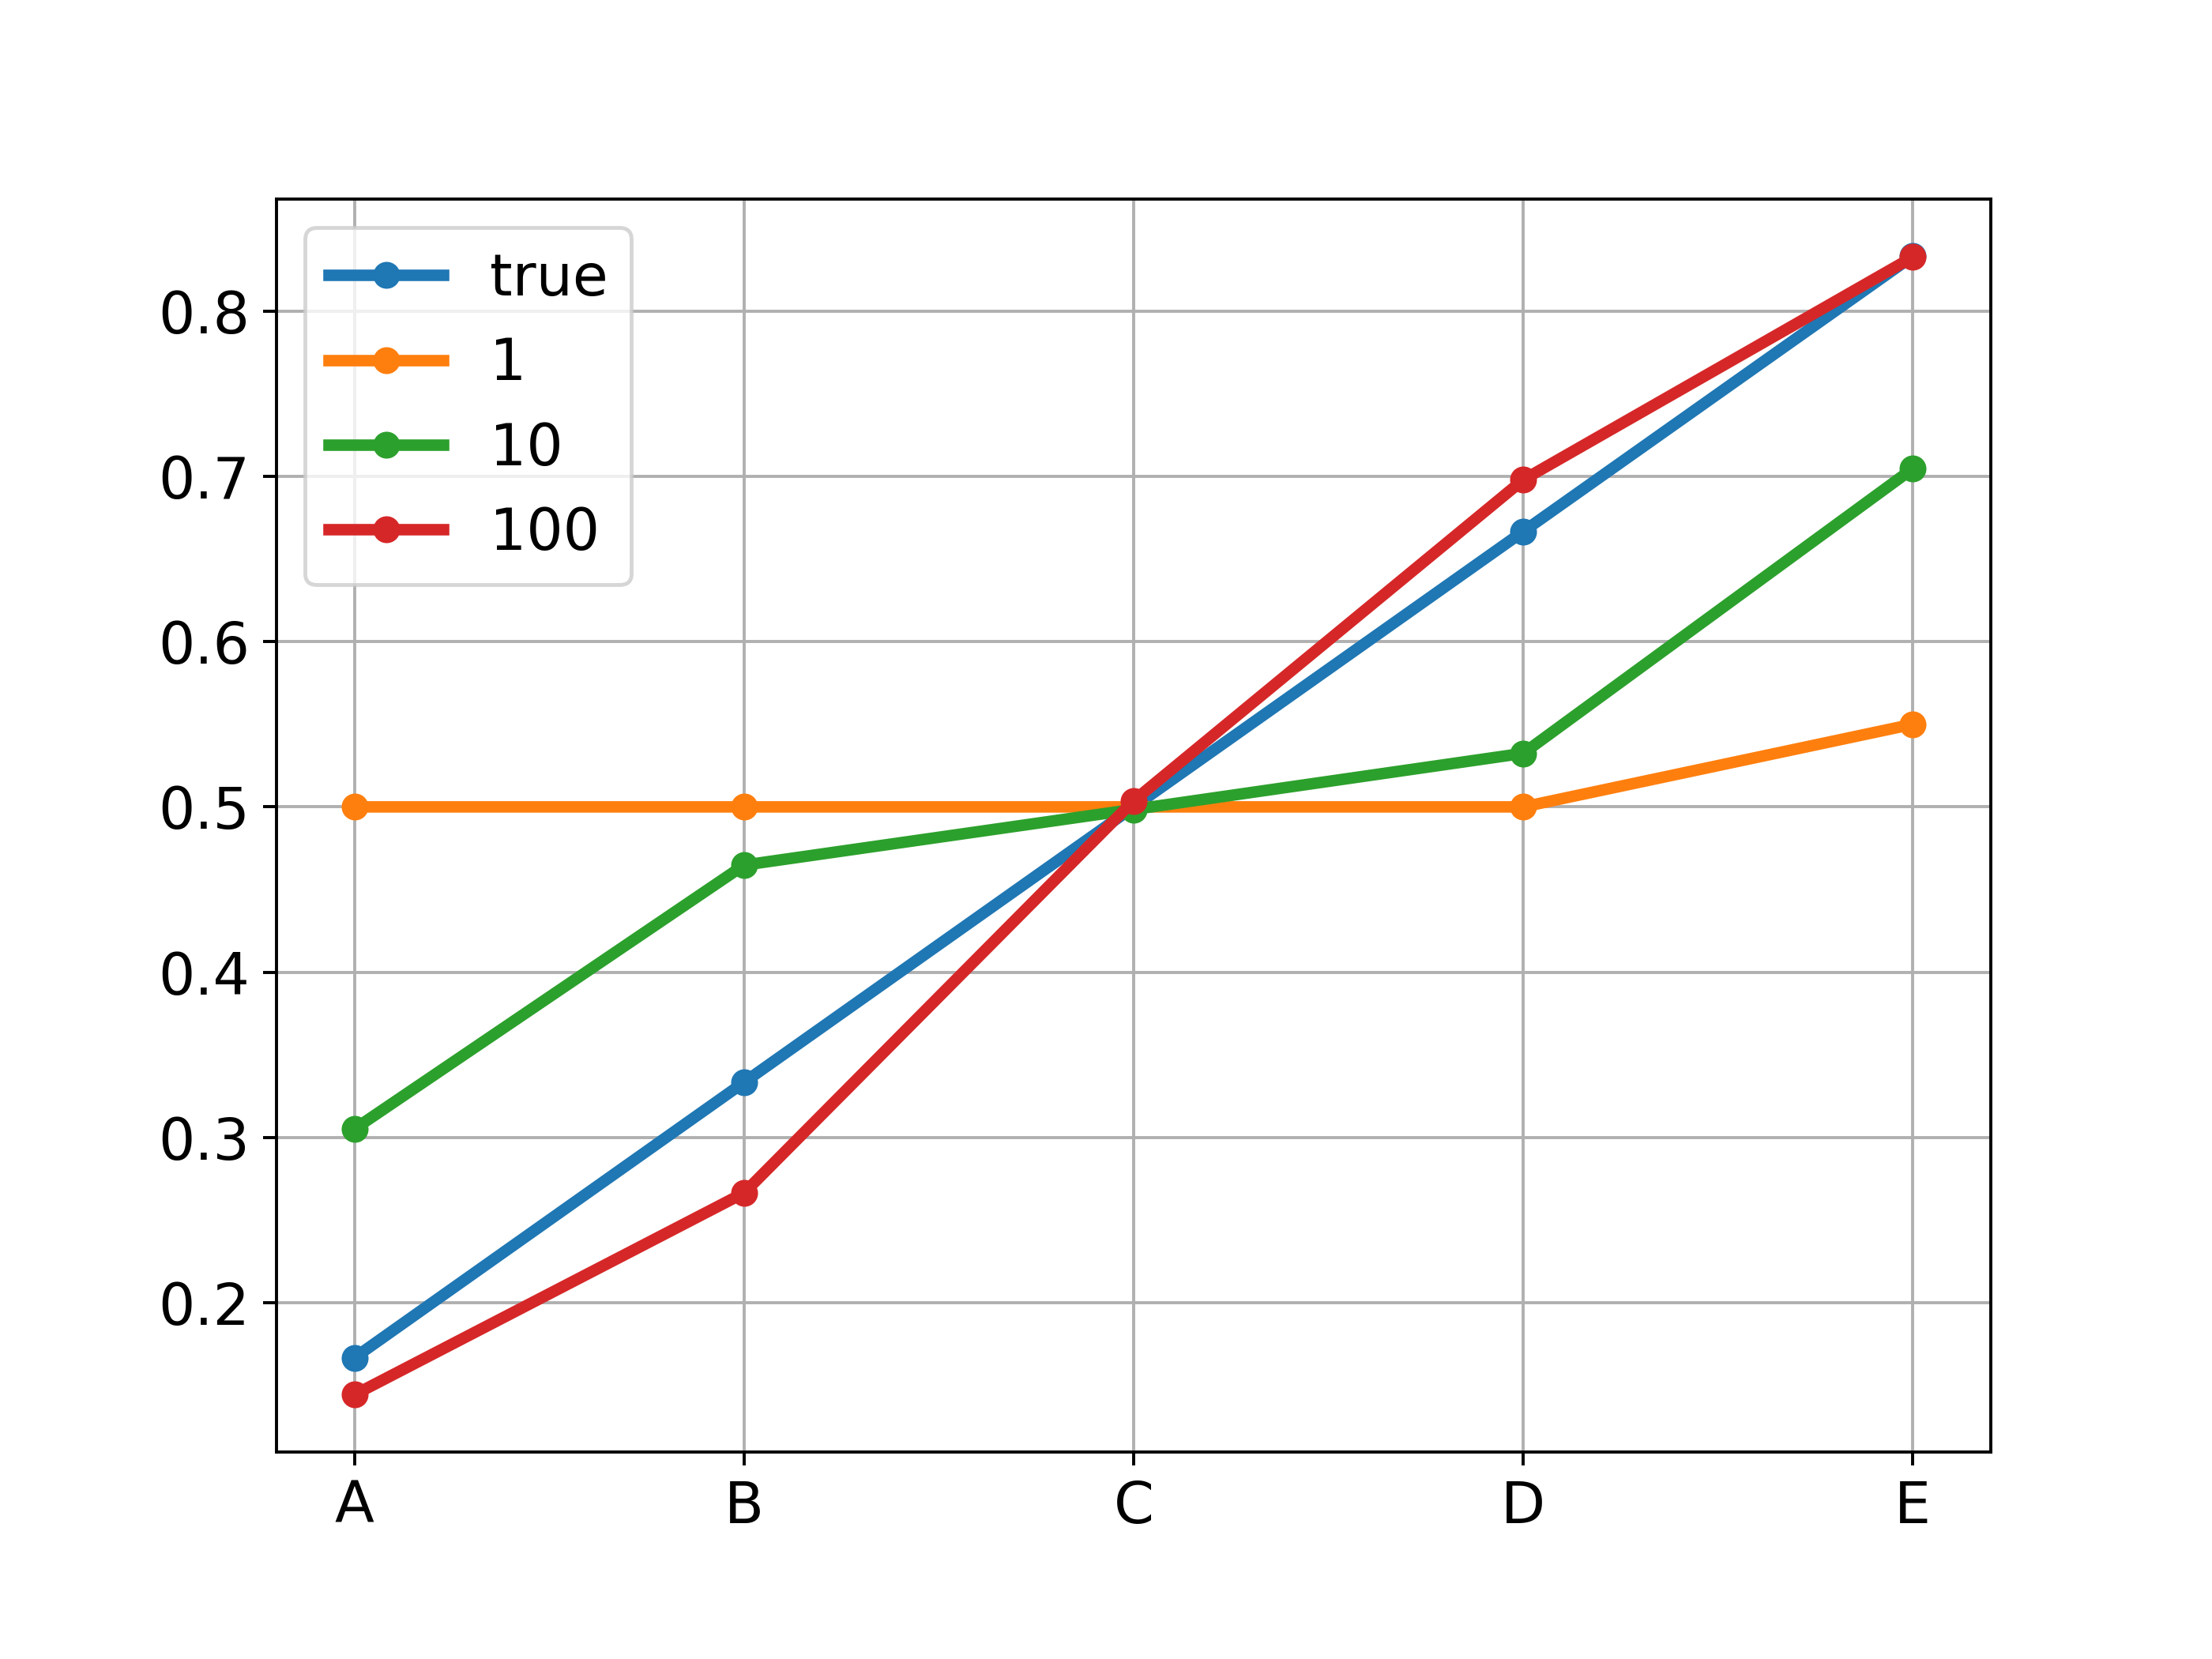
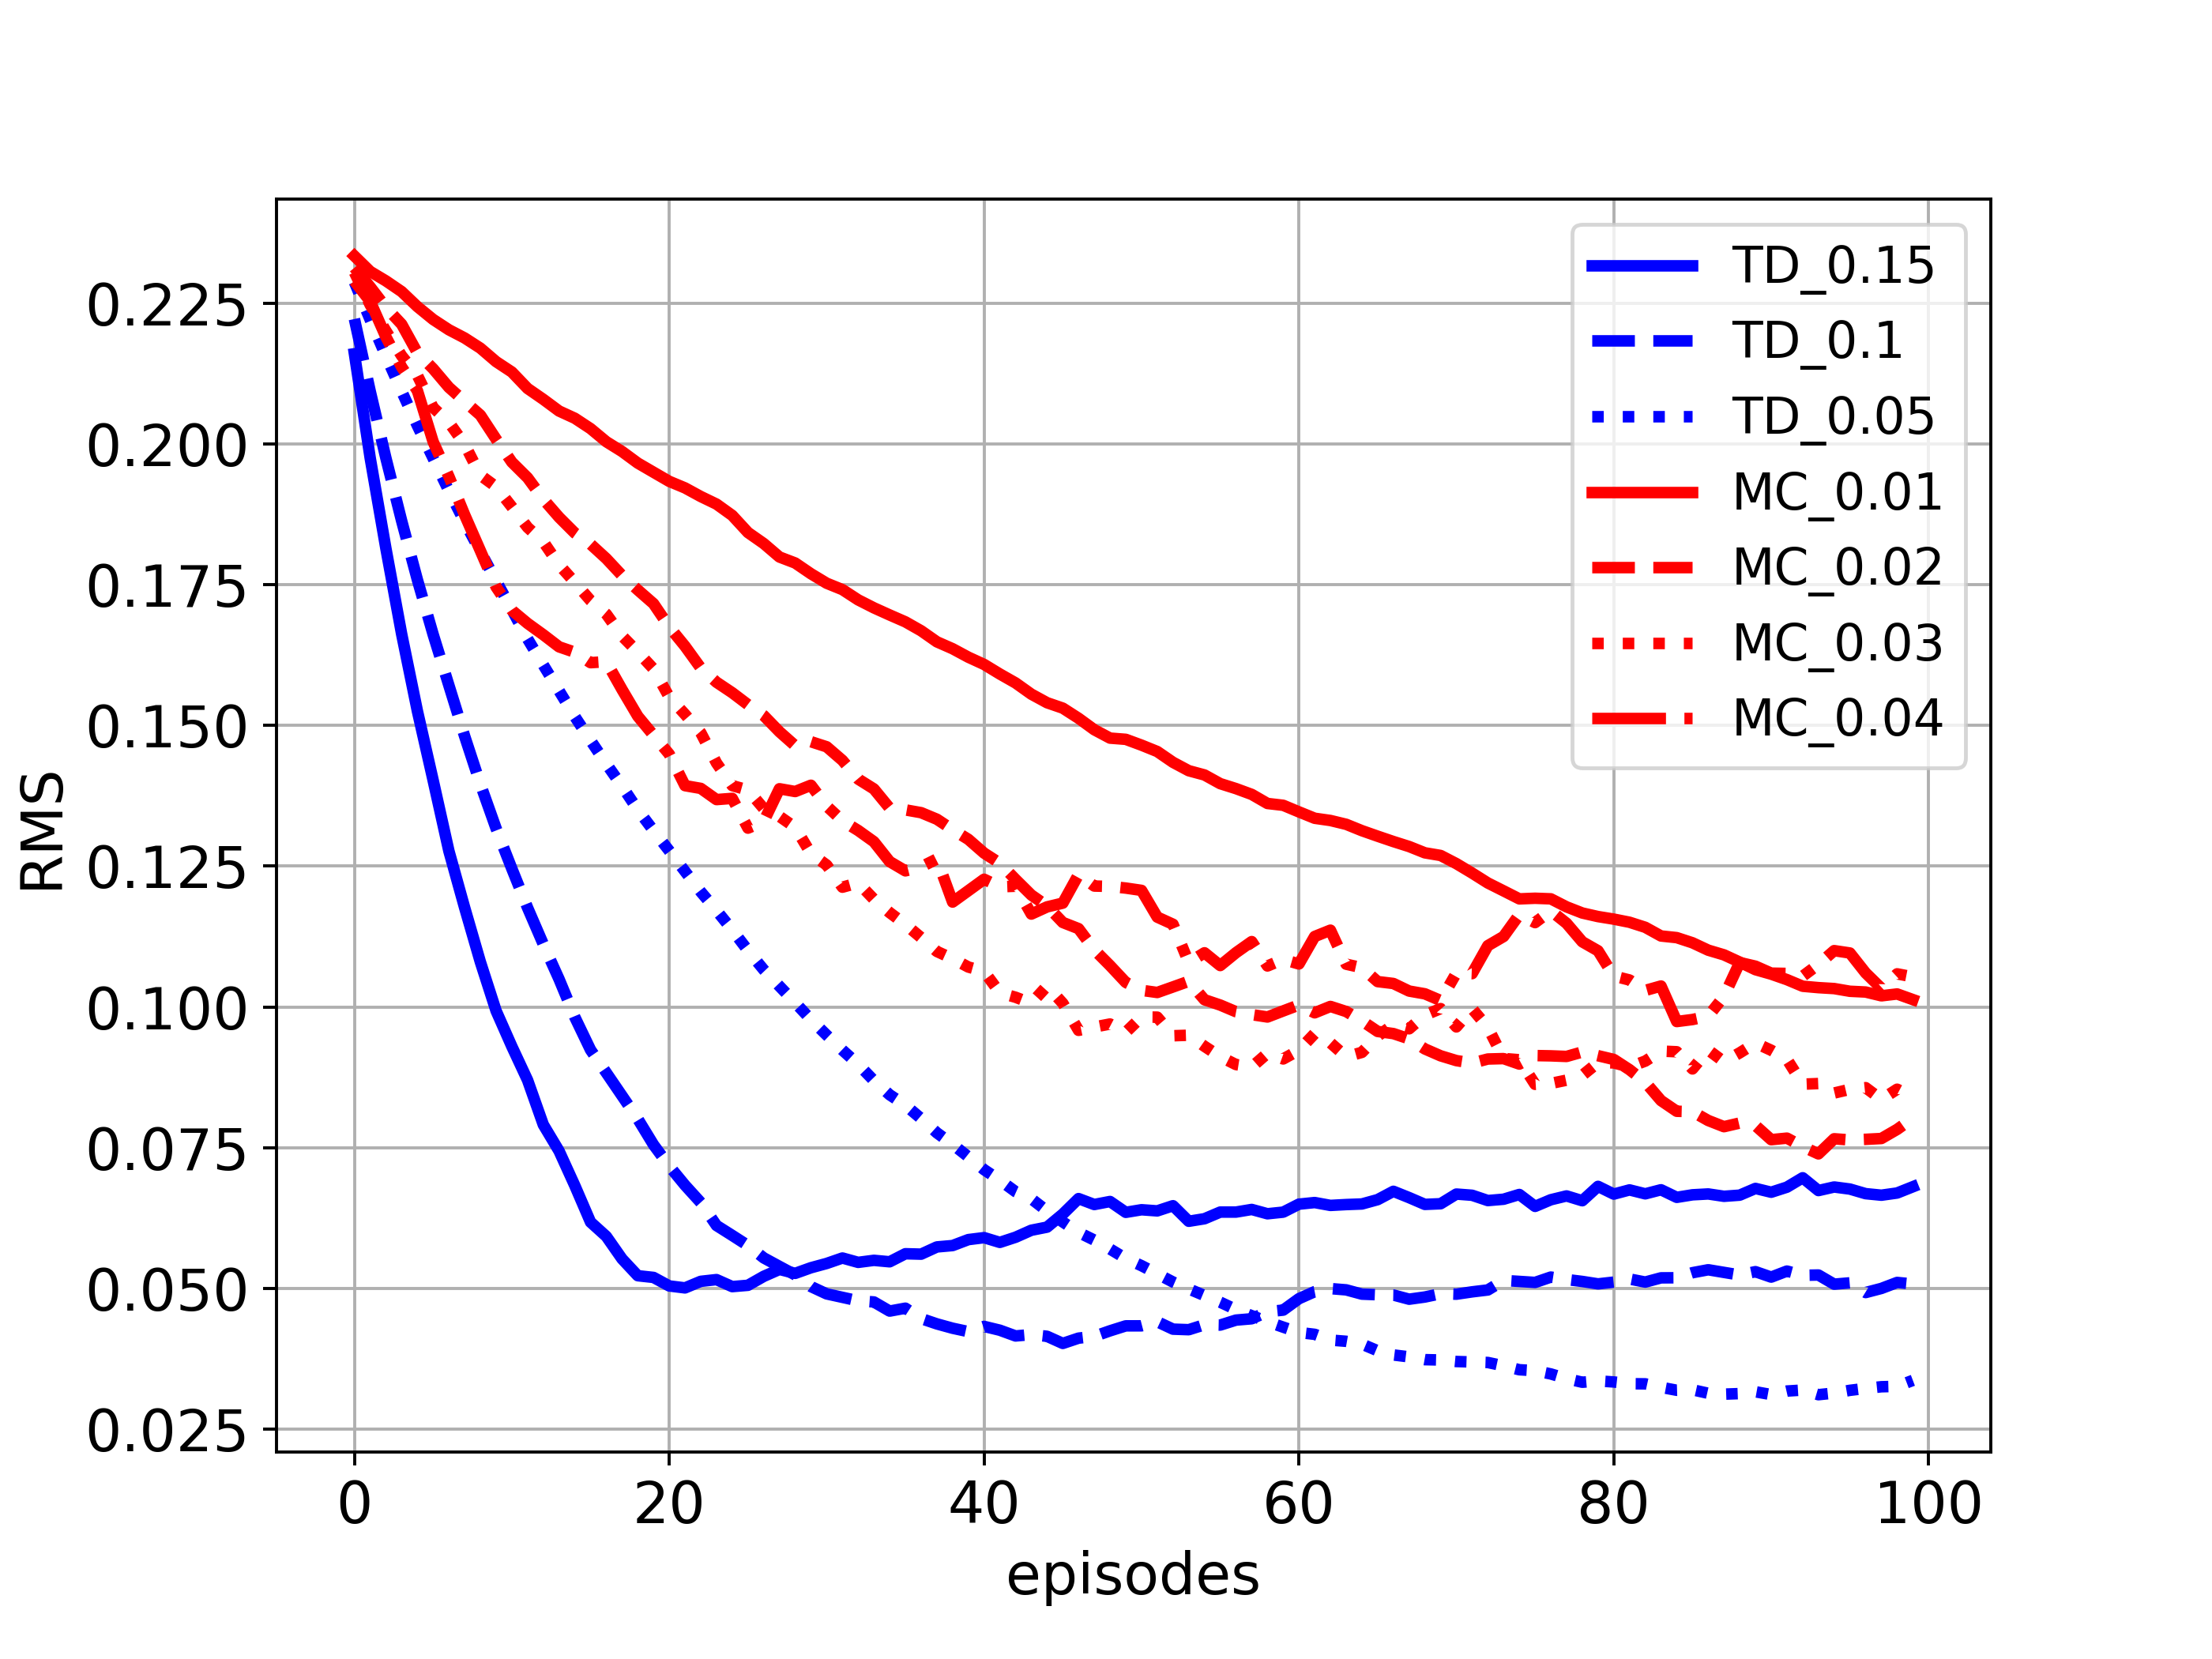
The above figures correspond to Figures in Example 6.2
Batch updating:
Under batch updating, TD(0) converges deterministically to a single answer independent of the lr, as long as lr is chosen to be sufficiently small, while constant MC does the same but to a different answer.
def get_traj(method='td'):

    s=np.random.choice(states[1:6])
    traj=[s]
    rew=[0]
    while True:

        s_old=s
        a=np.random.choice(actions)
        s,r,done=step(s_old,a)
        traj.append(s)
        rew.append(r)

        if done:
            break

    if method=='td':
        return traj, rew
    else:
        return traj, [r]*(len(traj)-1)

def get_batch(method='td',lr=0.001,n_runs=100,n_eps=100):

    rms_all=[]

    for n in range(n_runs):

        trajs=[]
        rews=[]
        rms=[]
        V=np.array([0.,-1.,-1.,-1.,-1.,-1.,1.])

        for ep in range(n_eps):

            traj,rew=get_traj(method=method)
            trajs.append(traj)
            rews.append(rew)

            while True:

                V_batch=np.zeros(len(states))
                for tj,r in zip(trajs,rews):
                    for i in range(0,len(tj)-1):
                        if method=='td':
                            V_batch[tj[i]]+=r[i]+V[tj[i+1]]-V[tj[i]]
                        else:
                            V_batch[tj[i]]+=r[i]-V[tj[i]]

                V_batch*=lr

                if np.sum(np.abs(V_batch))<1e-3:
                    break

                V+=V_batch

            rms.append(np.sqrt(np.sum(np.power(V_true-V[1:6],2))/5.0))

        rms_all.append(rms)

    return np.array(rms_all).mean(axis=0)

rms_td=get_batch(method='td')
rms_mc=get_batch(method='mc')

plt.figure(figsize=(8,6))
plt.plot(rms_td,label='TD',linewidth=3)
plt.plot(rms_mc,label='MC',linewidth=3)
plt.ylim([0,0.25])
plt.xticks(fontsize=15)
plt.yticks(fontsize=15)
plt.xlabel('episodes',fontsize=15)
plt.ylabel('RMS',fontsize=15)
plt.legend(fontsize=15)
plt.grid()
plt.savefig('batch_randomwalk.png',dpi=350)
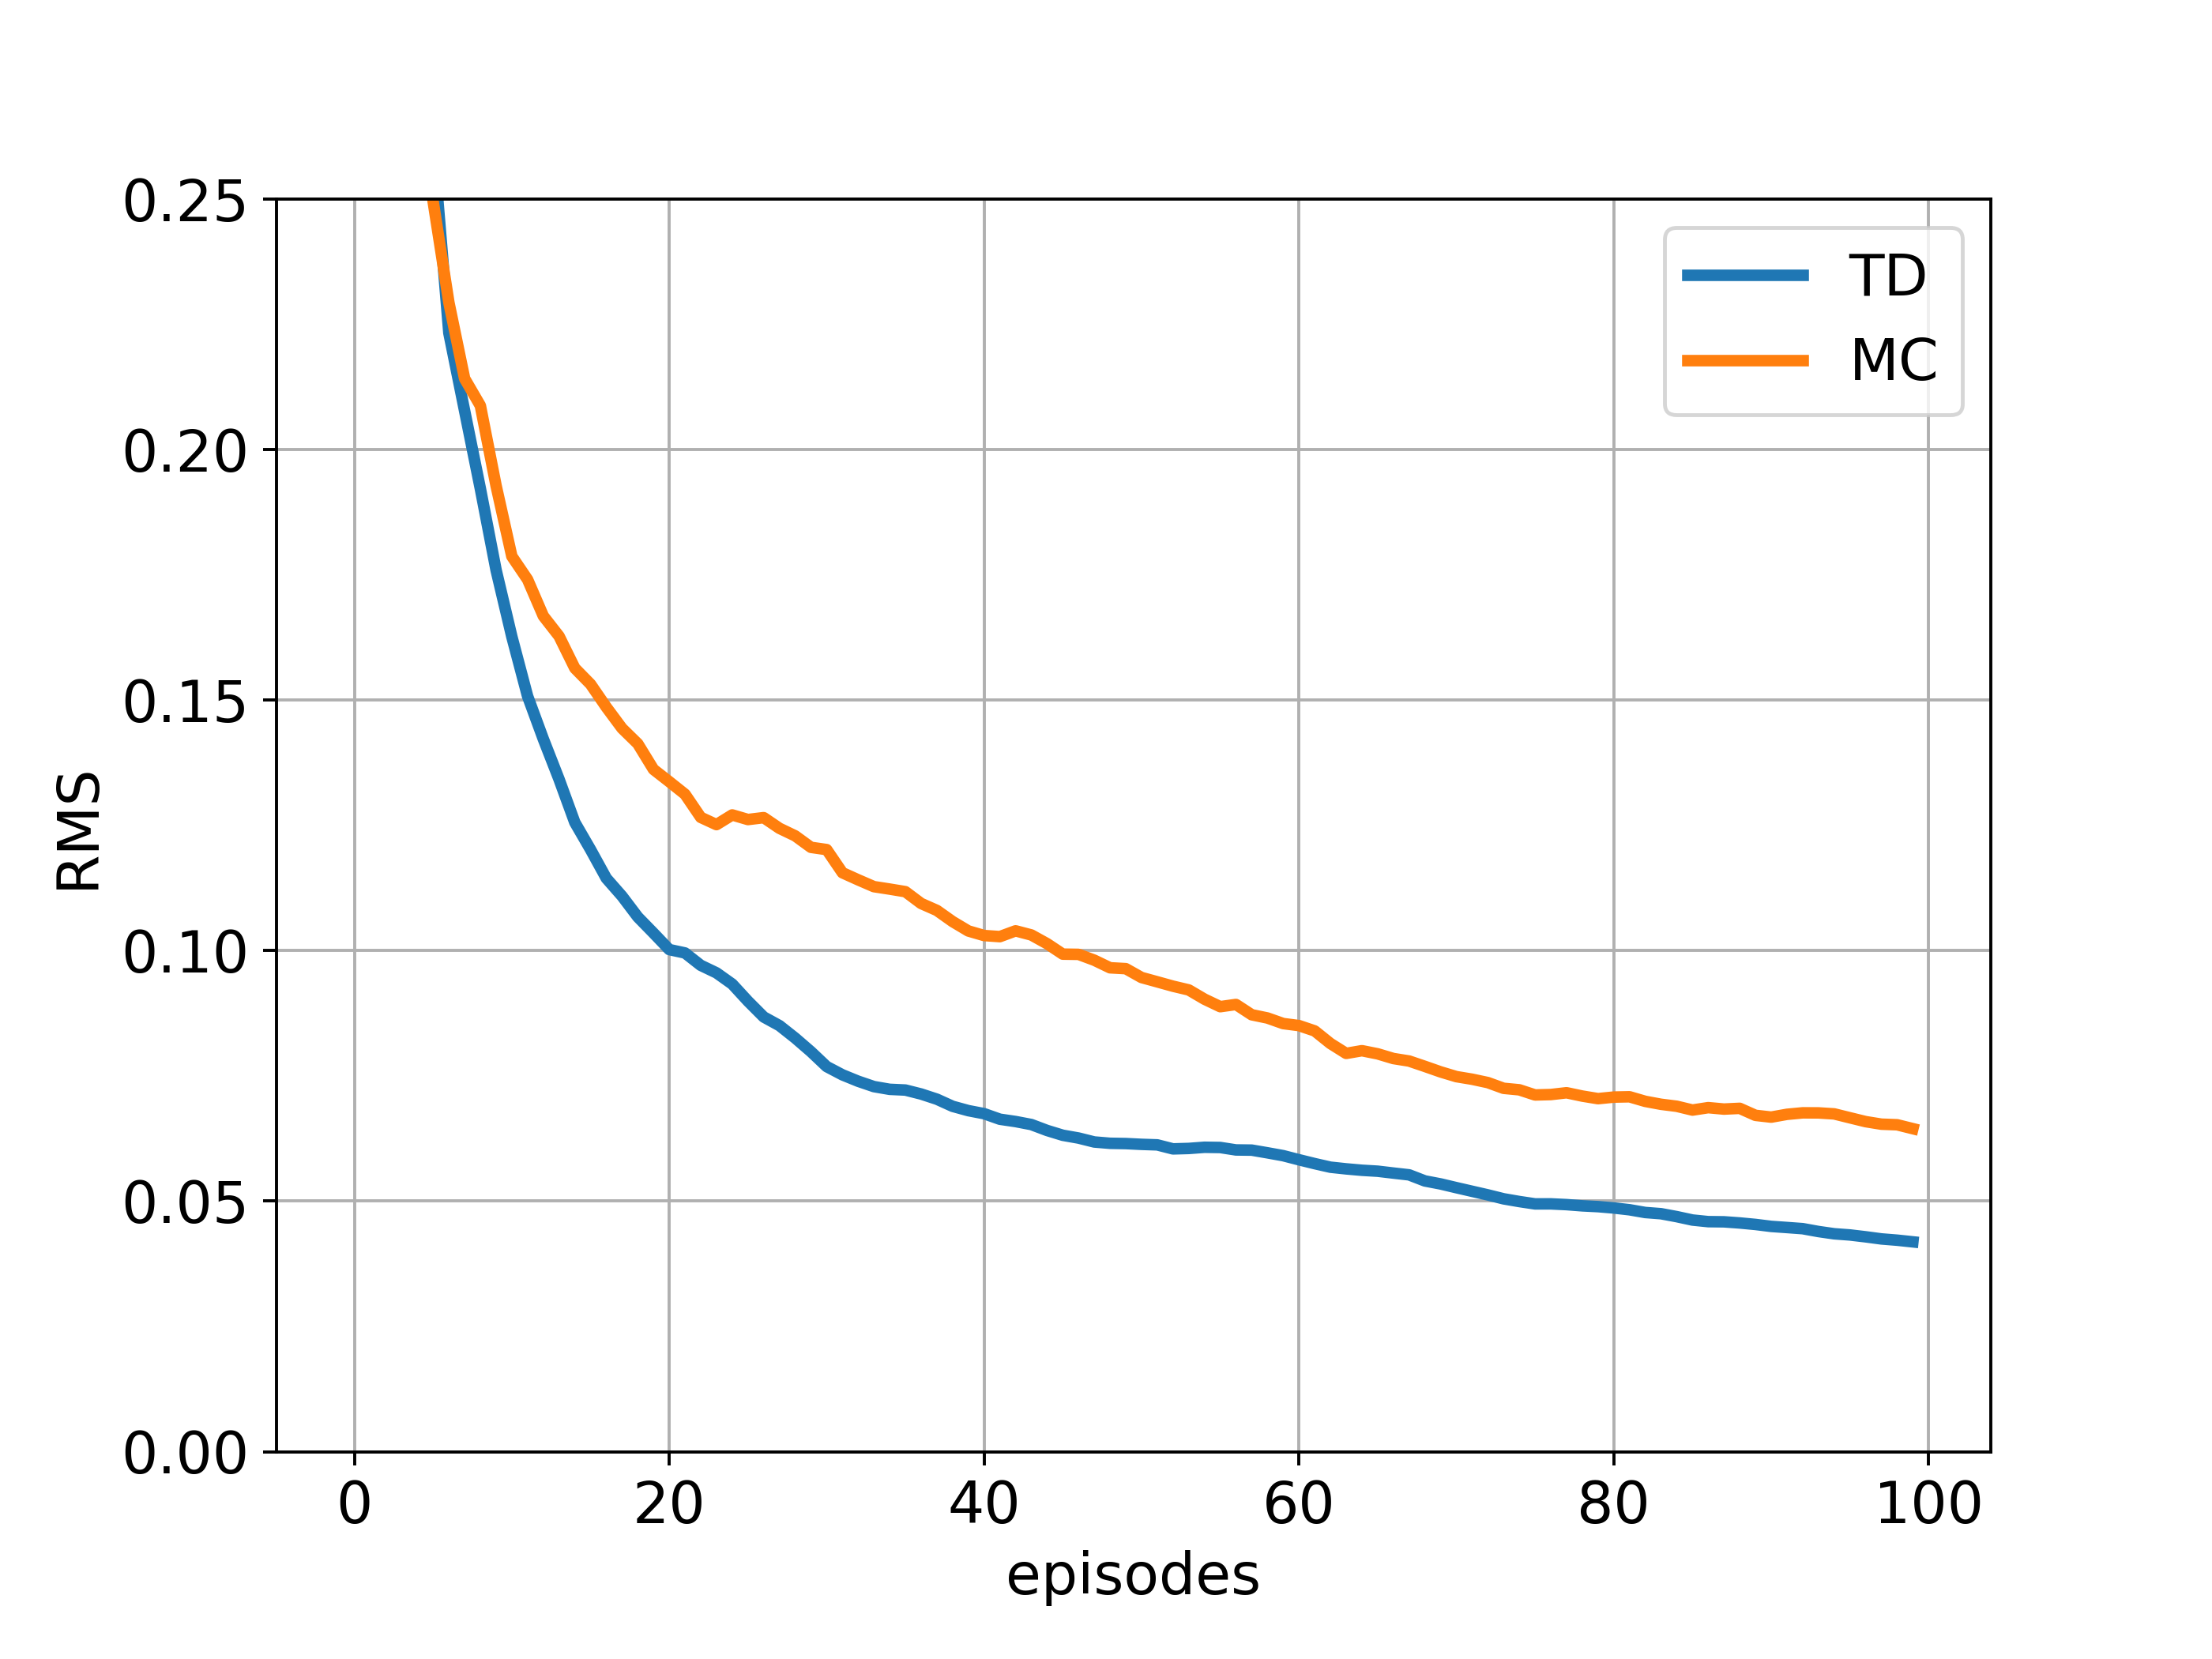
The above figure corresponds to Figure 6.2
Windy Gridworld

a standard gridworld, except there is a crosswind running upward through the middle of grid

an undiscounted episodic task

states = 7 x 10
actions = {up, down, left, right}

START=[3,0]
GOAL=[3,7]

dynamics:
col 3:5,8, wind strengh = 1, shift to one upper state (col started from 0)
col 6:7, wind strengh = 2, shift to two upper state

termination: reach goal
r=-1 until goal

epsilon: 0.1
lr: 0.5
Implementation of SARSA:
import numpy as np
import matplotlib.pyplot as plt
import seaborn as sns

n_cols=10
n_rows=7

actions=[0,1,2,3] #up,down,left,right
n_a=len(actions)

START=[3,0]
GOAL=[3,7]
WIND=[0,0,0,1,1,1,2,2,1,0]

def step(s,a):

    row,col=s

    if a==0:
        s_=[max(row-1-WIND[col],0),col]
    elif a==1:
        s_=[max(min(row+1-WIND[col],n_rows-1),0),col]
    elif a==2:
        s_=[max(row-WIND[col],0), max(col-1,0)]
    else:
        s_=[max(row-WIND[col],0), min(col+1, n_cols-1)]

    if s_==GOAL:
        return s_,0,True
    else:
        return s_,-1,False

def e_greedy(eps,q):

    if (np.random.random()<=eps):
        return np.random.choice(actions)
    else:
        return np.argmax(q)

def run_sarsa(n_eps=500,n_stps=500,eps=0.1,lr=0.5,gm=1.):

    Q=np.zeros((n_rows,n_cols,n_a))

    r_all,stp_all,cnt_all=[],[],[]
    stpCnt=0

    for ep in range(n_eps):

        r_sum,done=0,False
        s=START
        a=e_greedy(eps,Q[s[0],s[1]])

        for stp in range(n_stps):

            s_,r,done=step(s,a)
            a_=e_greedy(eps,Q[s_[0],s_[1]])
            delta=r+gm*Q[s_[0],s_[1],a_]-Q[s[0],s[1],a]
            Q[s[0],s[1],a]+=lr*delta

            s=s_
            a=a_
            r_sum+=r
            stpCnt+=1

            if done:
                break

        r_all.append(r_sum)
        stp_all.append(stp)
        cnt_all.append(stpCnt)

        if ep%10==0:
            print(f'ep:{ep}, stps:{stp}, ret:{r_sum}')

    return Q,r_all,stp_all,cnt_all

Q,r,stp,cnt=run_sarsa()
Draw figures:
q_heat=np.zeros((n_rows,n_cols))

for i in range(n_rows):
    for j in range(n_cols):
        q_heat[i,j]=np.max(Q[i,j])

plt.figure(figsize=(6,8))
plt.subplot(211)
sns.heatmap(q_heat,cmap='jet',annot=True)
plt.annotate('S',(0.3,3.7),fontsize=20,color="w")
plt.annotate('G',(7.3,3.7),fontsize=20,color="w")
plt.savefig('heatmap_windygrid.png',dpi=350)

op_act=np.zeros((n_rows,n_cols))

for i in range(n_rows):
    for j in range(n_cols):
        op_act[i,j]=np.argmax(Q[i,j])

nx=10
ny=7

scale=0.3
edge=ny-0.5
fig=plt.figure(figsize=(6,6))
ax=fig.add_subplot(1,1,1)
ax.set_aspect('equal', adjustable='box')
ax.set_xticks(np.arange(0,nx+1,1))
ax.set_yticks(np.arange(0,ny+1,1))
plt.grid()
plt.ylim((0,ny))
plt.xlim((0,nx))

for i in range(n_rows):
    for j in range(n_cols):
        if op_act[i,j]==0:
            plt.arrow(j+0.5,edge-i,0,scale,width=0.1, head_width=0.2, head_length=0.1,fc='g', ec='g')
        elif op_act[i,j]==1:
            plt.arrow(j+0.5,edge-i,0,-scale,width=0.1, head_width=0.2, head_length=0.1,fc='c', ec='c')
        elif op_act[i,j]==2:
            plt.arrow(j+0.5,edge-i,-scale,0,width=0.1, head_width=0.2, head_length=0.1,fc='b', ec='b')
        elif op_act[i,j]==3:
            plt.arrow(j+0.5,edge-i,scale,0,width=0.1, head_width=0.2, head_length=0.1,fc='r', ec='r')

plt.annotate('S',(0.3,3.3),fontsize=20)
plt.annotate('G',(7.3,3.3),fontsize=20)
plt.savefig('oppi_windygrid.png',dpi=350)

fig=plt.figure(figsize=(12,10))
plt.rcParams['font.size']='10'
plt.subplot(221)
plt.plot(r,linewidth=3,color='orange')
plt.grid()
plt.xlabel('Episodes')
plt.ylabel('Return')
plt.subplot(222)
plt.plot(stp,linewidth=3,color='orange')
plt.grid()
plt.xlabel('Episodes')
plt.ylabel('Steps')

plt.subplot(223)
plt.plot(cnt[:170],range(170),linewidth=3,color='orange')
plt.grid()
plt.xlabel('Steps')
plt.ylabel('Episodes')

plt.savefig('res_windygrid.png',dpi=350)
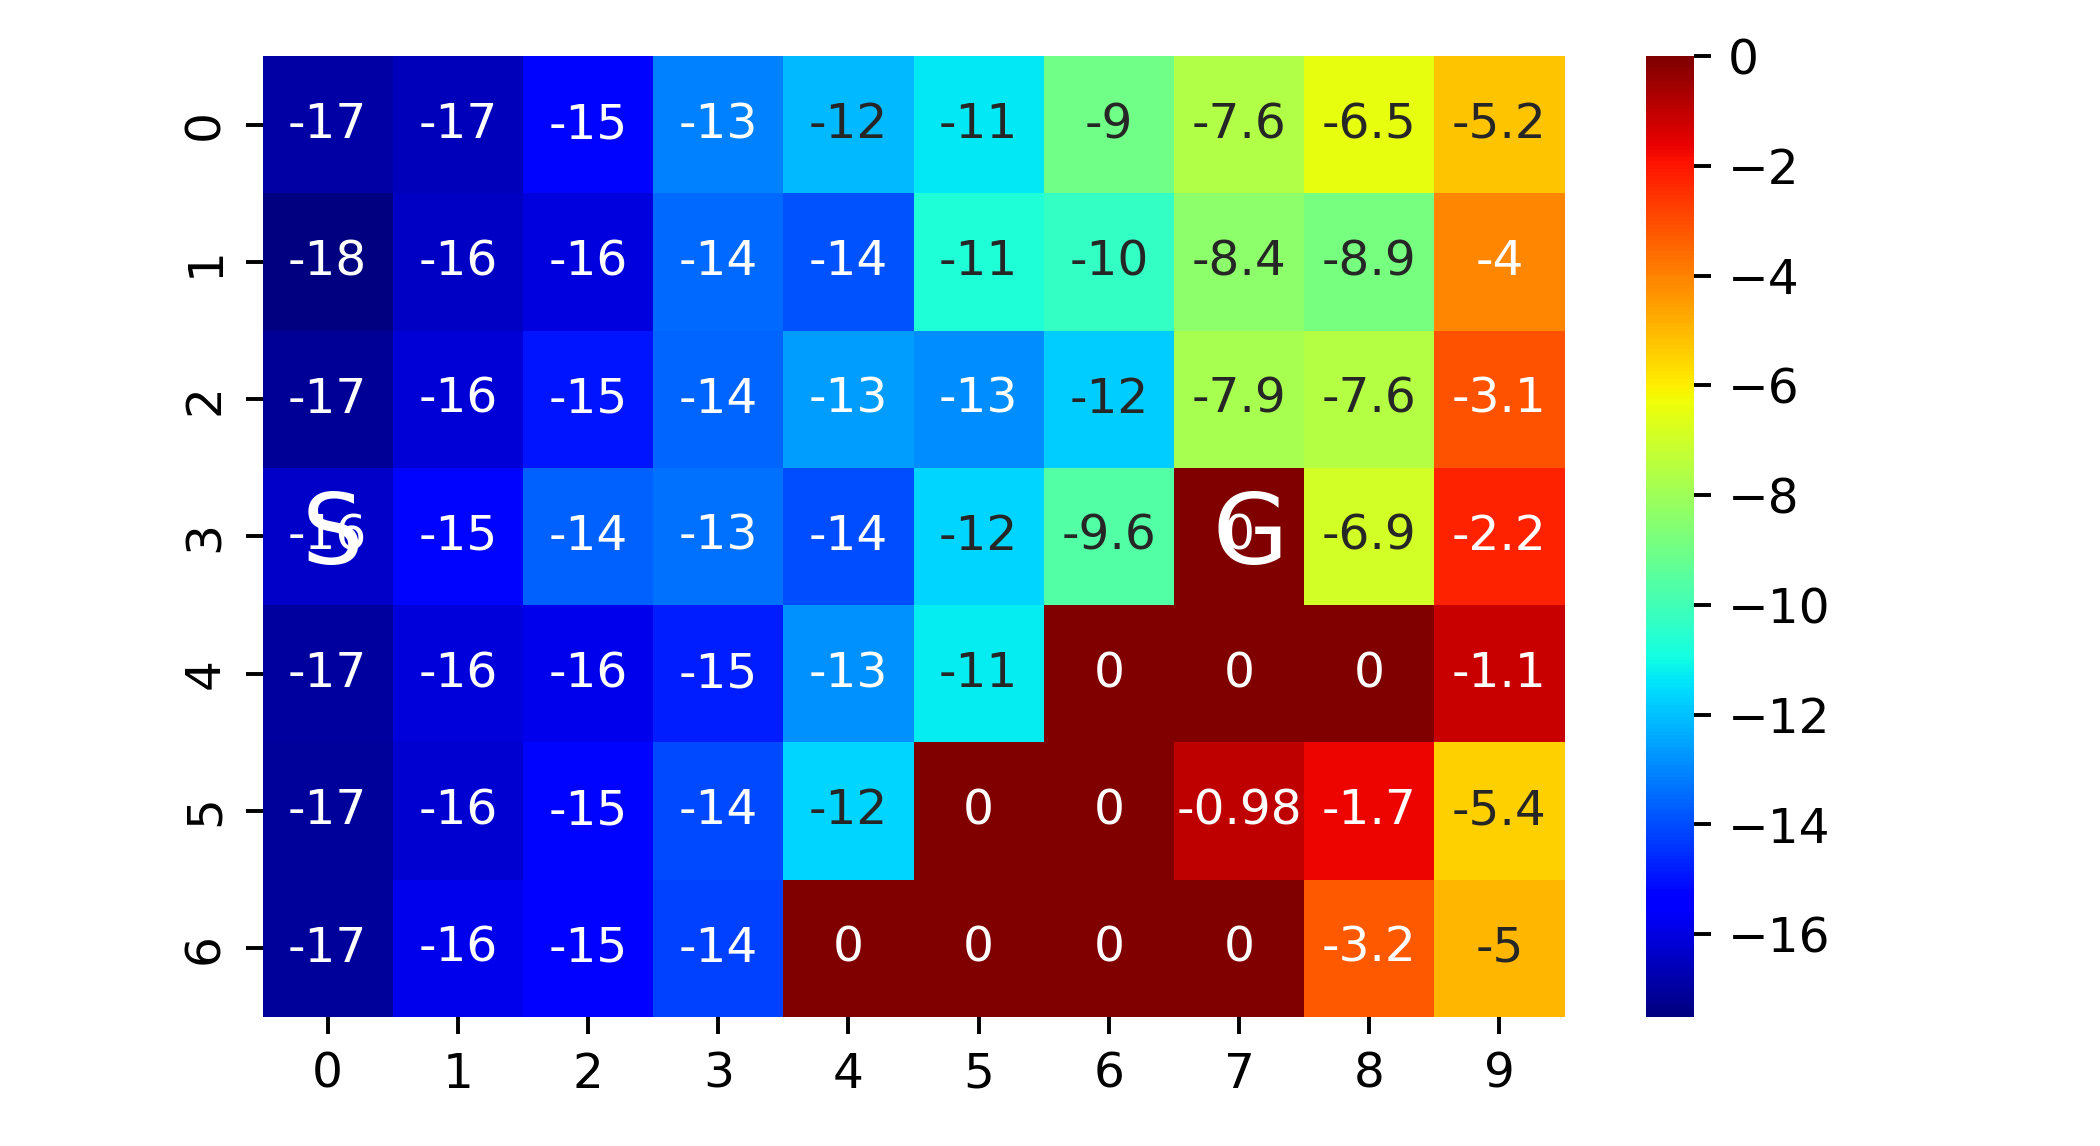
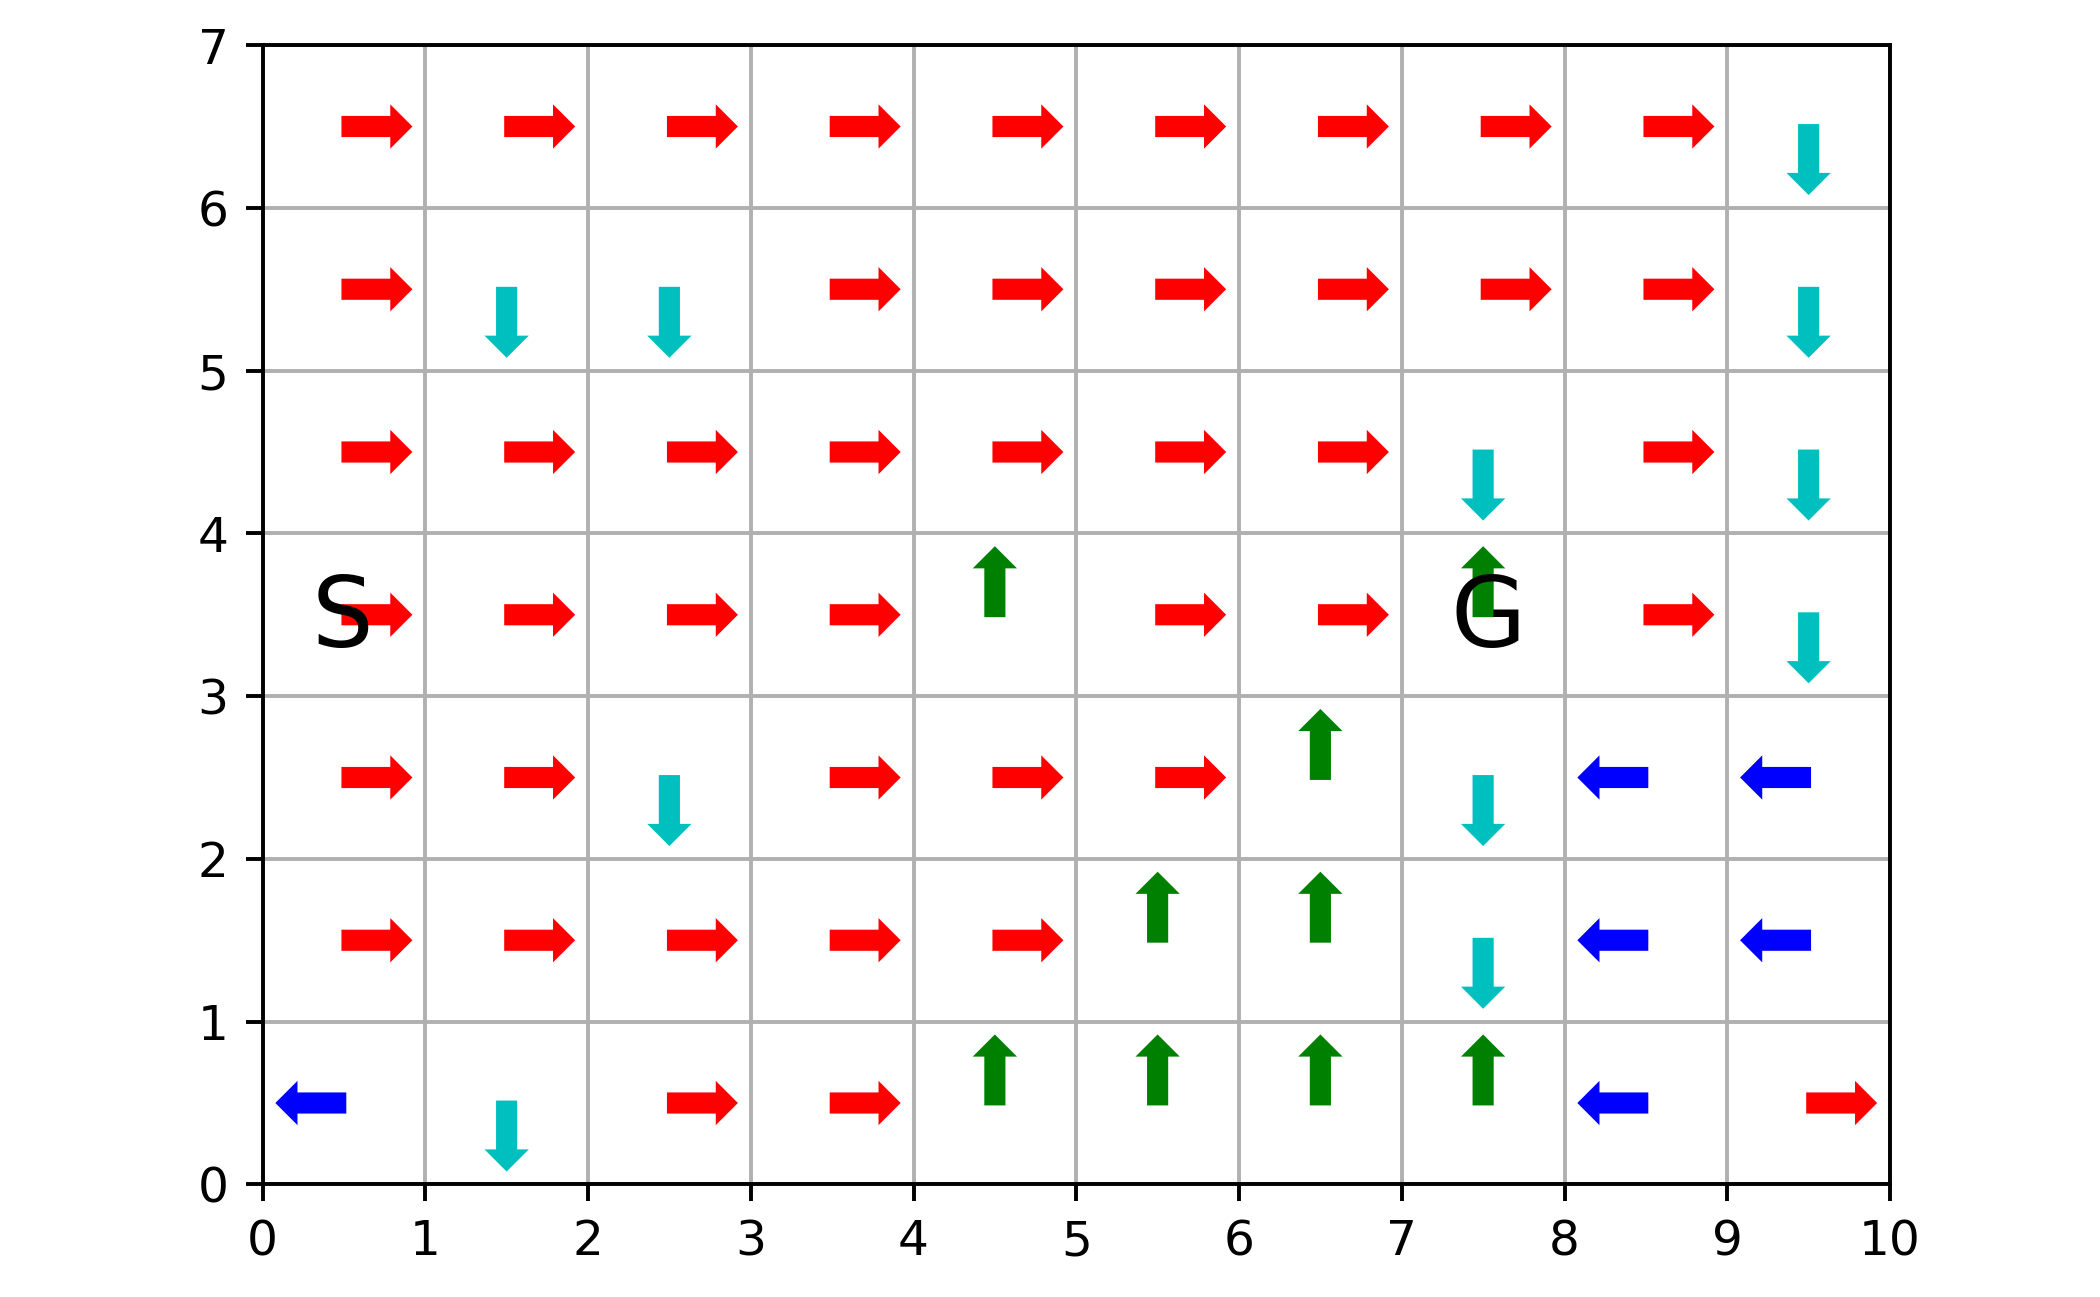
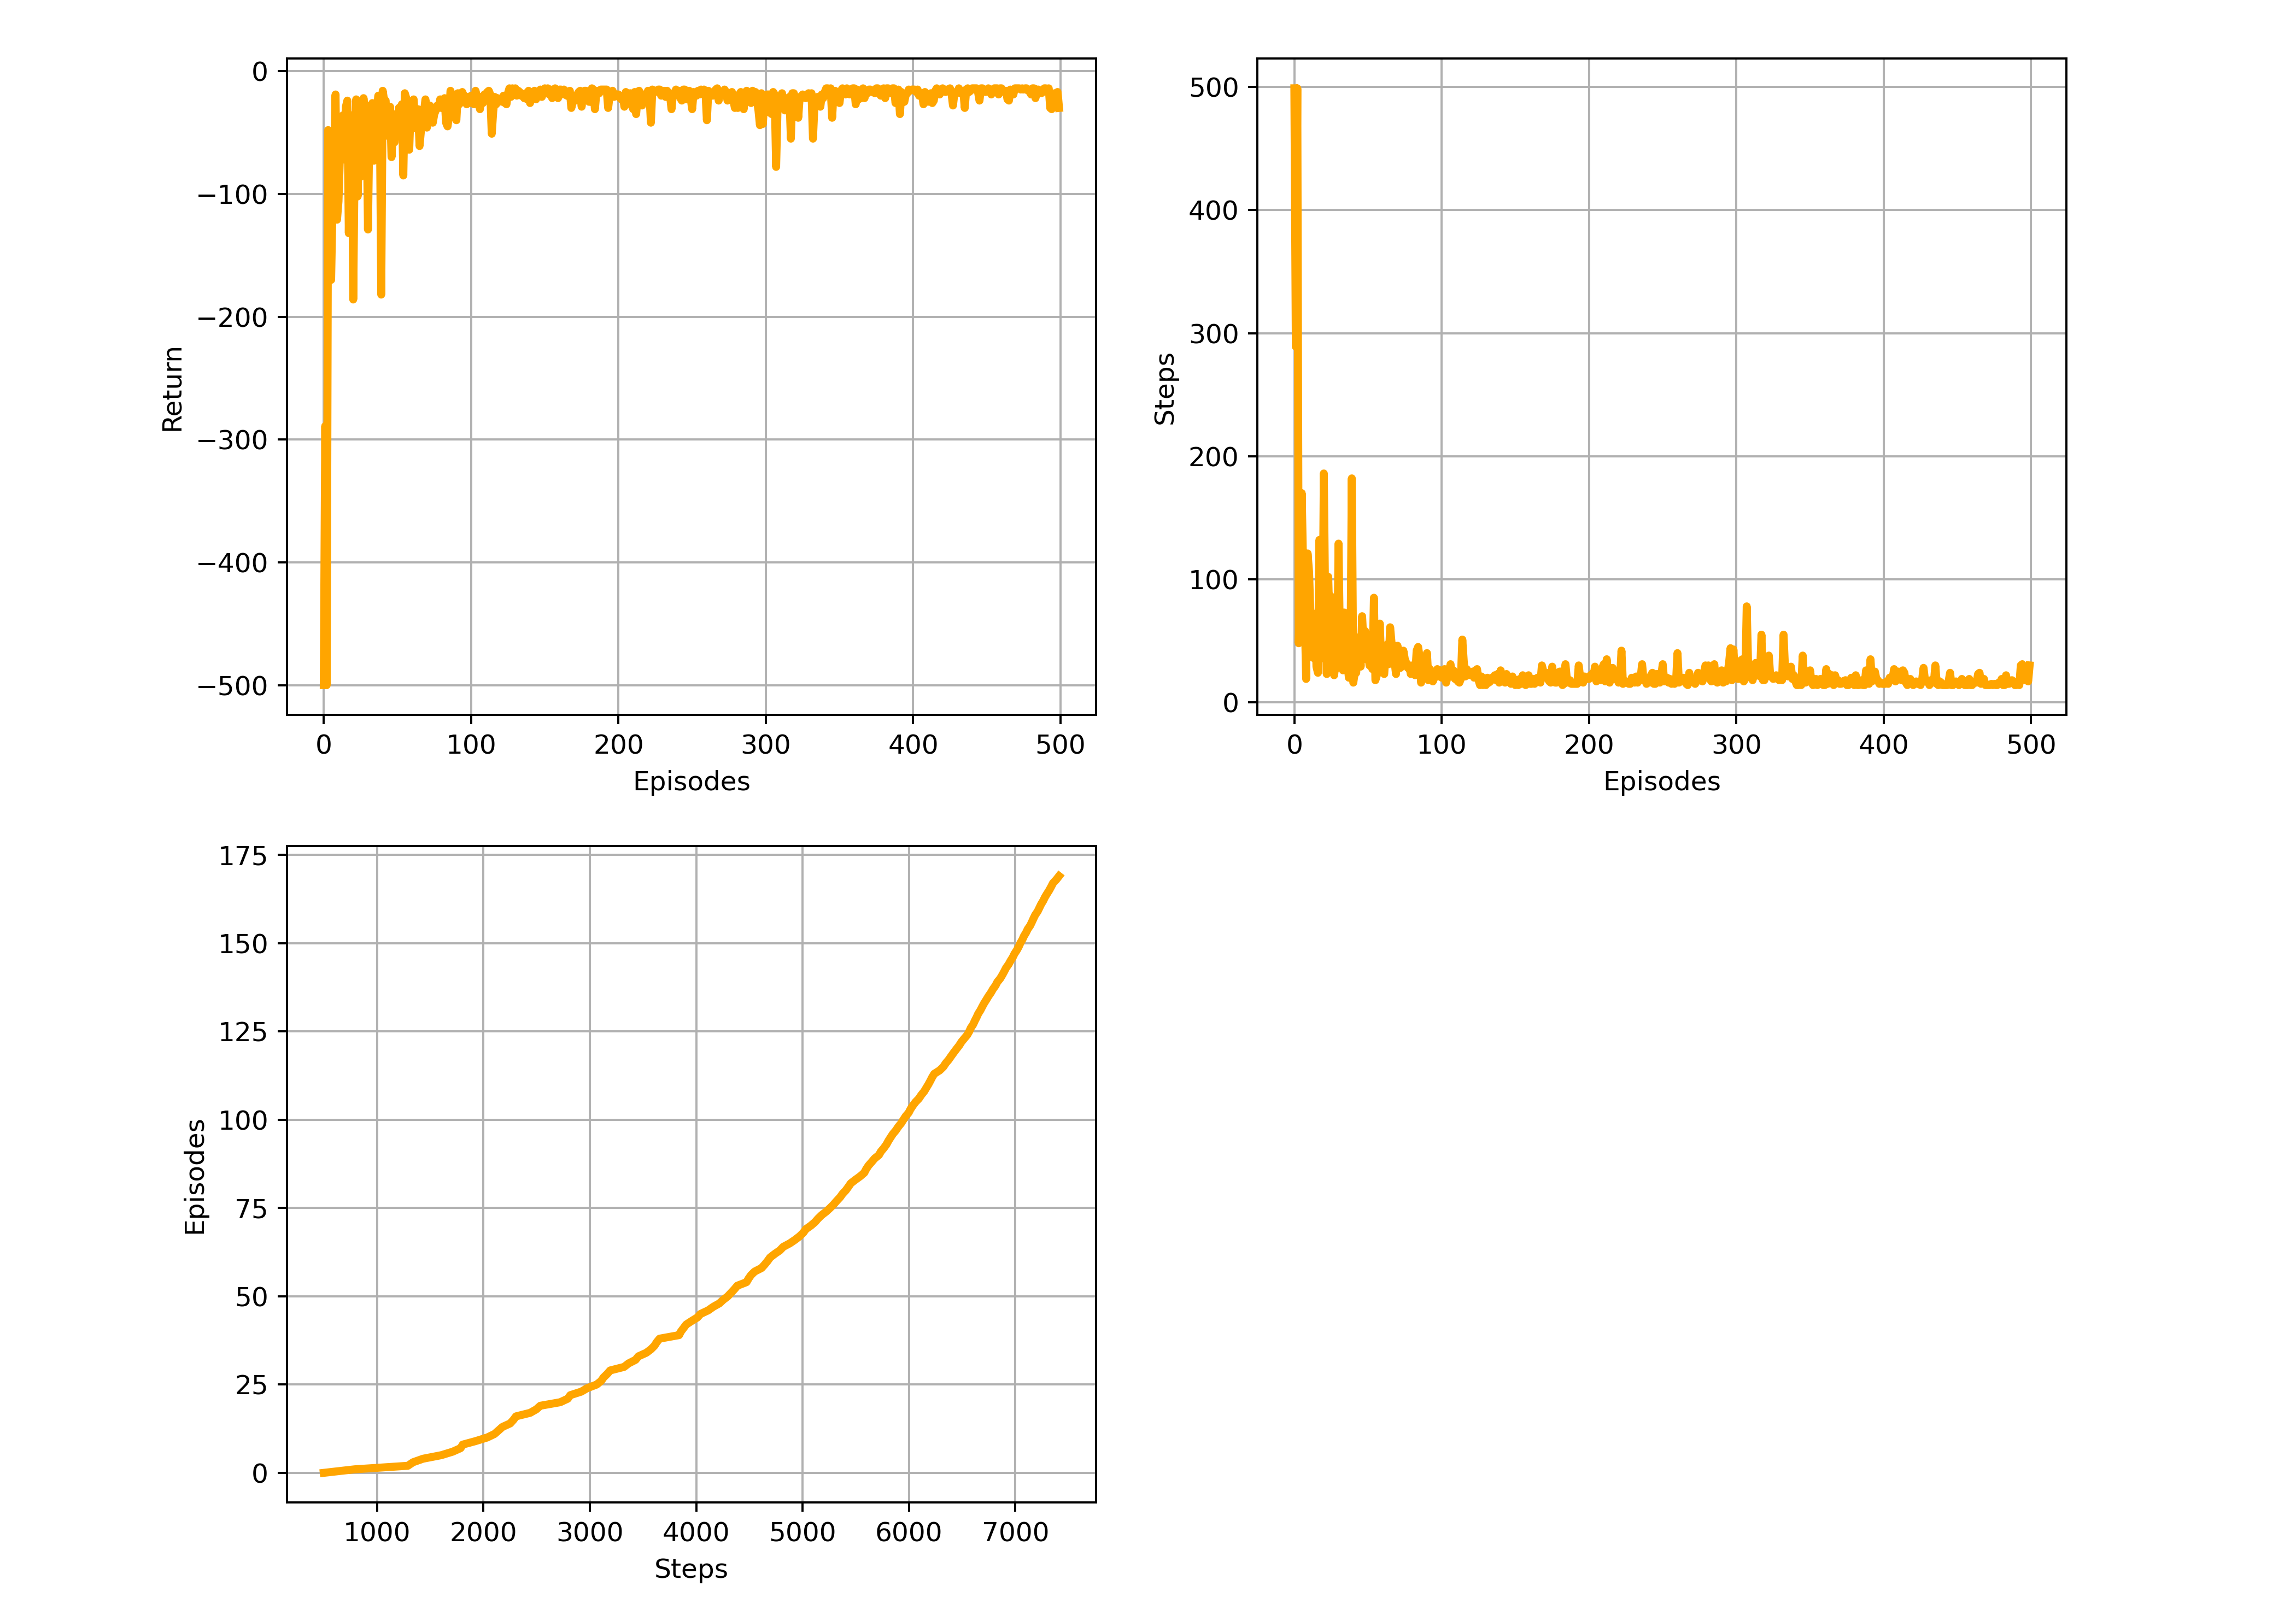
The above corresponds to figure in Example 6.5
Cliff Walking

a standard gridworld, except there is a cliff in the downside

an undiscounted episodic task

states = 4 x 12
actions = {up, down, left, right}

START = [3,0]
GOAL = [3,11]

termination: enter the cliff zone or reach goal
r=-1 all other than cliff region
r=-100 cliff region

epsilon: 0.1
lr: 0.5
Implementation of SARSA and expected SARSA:
import numpy as np
import matplotlib.pyplot as plt
import seaborn as sns

n_cols=12
n_rows=4

actions=[0,1,2,3] #up,down,left,right
n_a=len(actions)

START=[3,0]
GOAL=[3,11]
CLIFF=list(range(1,11))

def step(s,a):

    row,col=s

    if a==0: #up
        s_=[max(row-1,0),col]
    elif a==1: #down
        s_=[min(row+1,n_rows-1),col]
    elif a==2: #left
        s_=[row, max(col-1,0)]
    else: #right
        s_=[row, min(col+1, n_cols-1)]

    if s_==GOAL:
        return s_,0,True
    elif s_[0]==n_rows-1 and s_[1] in CLIFF:
        return s_,-100,True
    else:
        return s_,-1,False

def e_greedy(eps,q):

    if (np.random.random()<=eps):
        return np.random.choice(actions)
    else:
        return np.random.choice([a for a, qs in enumerate(q) if qs==np.max(q)])
        #return np.argmax(q)

def run_sarsa(expected=False,n_eps=500,n_stps=500,eps=0.1,lr=0.5,gm=1.):

    Q=np.zeros((n_rows,n_cols,n_a))

    r_all,stp_all,cnt_all=[],[],[]
    stpCnt=0

    for ep in range(n_eps):

        r_sum,done=0,False
        s=START
        a=e_greedy(eps,Q[s[0],s[1]])

        for stp in range(n_stps):

            s_,r,done=step(s,a)
            a_=e_greedy(eps,Q[s_[0],s_[1]])

            if not expected:
                delta=r+gm*Q[s_[0],s_[1],a_]-Q[s[0],s[1],a]
            else:
                Q_exp=0.0
                Q_=Q[s_[0],s_[1],:]
                a_bests=np.argwhere(Q_==np.max(Q_))
                for act in actions:
                    if act in a_bests:
                        Q_exp+=((1.0-eps)/len(a_bests)+eps/len(actions))*Q[s_[0],s_[1],act]
                    else:
                        Q_exp+=eps/len(actions)*Q[s_[0],s_[1],act]
                delta=r+gm*Q_exp-Q[s[0],s[1],a]

            Q[s[0],s[1],a]+=lr*delta

            s=s_
            a=a_
            r_sum+=r
            stpCnt+=1

            if done:
                break

        r_all.append(r_sum)
        stp_all.append(stp)
        cnt_all.append(stpCnt)

        #if ep%100==0:
        #    print(f'ep:{ep}, stps:{stp}, ret:{r_sum}')

    return Q,r_all,stp_all,cnt_all

#Q_sarsa,r_sarsa,stp_sarsa,cnt_sarsa=run_sarsa()

n_runs=50

r_sarsa_all=[]
for n in range(n_runs):
    Q_sarsa,r_sarsa,stp_sarsa,cnt_sarsa=run_sarsa()
    r_sarsa_all.append(r_sarsa)
Implementation of Q-learning:
def run_q(n_eps=500,n_stps=500,eps=0.1,lr=0.5,gm=1.):

    Q=np.zeros((n_rows,n_cols,n_a))

    r_all,stp_all,cnt_all=[],[],[]
    stpCnt=0

    for ep in range(n_eps):

        r_sum,done=0,False
        s=START

        for stp in range(n_stps):

            a=e_greedy(eps,Q[s[0],s[1]])
            s_,r,done=step(s,a)
            delta=r+gm*np.max(Q[s_[0],s_[1]])-Q[s[0],s[1],a]
            Q[s[0],s[1],a]+=lr*delta

            s=s_
            r_sum+=r
            stpCnt+=1

            if done:
                break

        r_all.append(r_sum)
        stp_all.append(stp)
        cnt_all.append(stpCnt)

        #if ep%100==0:
        #    print(f'ep:{ep}, stps:{stp}, ret:{r_sum}')

    return Q,r_all,stp_all,cnt_all

n_runs=50

r_q_all=[]
for n in range(n_runs):
    Q_q,r_q,stp_q,cnt_q=run_q()
    r_q_all.append(r_q)
Draw figures:
r_q_all=np.array(r_q_all)
r_sarsa_all=np.array(r_sarsa_all)

plt.rcParams['font.size']='14'
plt.figure(figsize=(8,6))
plt.plot(r_q_all.mean(axis=0),'r',label='q-learning')
plt.plot(r_sarsa_all.mean(axis=0),'b',label='sarsa')
plt.ylim([-100,-10])
plt.legend()
plt.grid()
plt.xlabel('Episodes')
plt.ylabel('Returns during episode')
plt.savefig('sarsa_ql_cliffwalk.png',dpi=350)
plt.close()

def plot_heat(q,alg='sarsa'):

    q_heat=np.zeros((n_rows,n_cols))

    for i in range(n_rows):
        for j in range(n_cols):
            q_heat[i,j]=np.max(q[i,j])

    plt.figure(figsize=(8,4))
    sns.heatmap(q_heat,cmap='jet',annot=True)
    plt.annotate('S', (0.3,3.7), fontsize=20, color="w")
    plt.annotate('G', (11.3,3.7), fontsize=20, color="w")
    plt.title(alg)
    plt.savefig(alg+'_heatmap_cliffwalk.png',dpi=350)
    plt.close()

def plot_oppi(q,alg='sarsa'):

    op_act=np.zeros((n_rows,n_cols))

    for i in range(n_rows):
        for j in range(n_cols):
            op_act[i,j]=np.argmax(q[i,j])

    nx=12
    ny=4

    scale=0.3
    edge=ny-0.5
    fig=plt.figure(figsize=(8,4))
    ax=fig.add_subplot(1,1,1)
    ax.set_aspect('equal', adjustable='box')
    ax.set_xticks(np.arange(0,nx+1,1))
    ax.set_yticks(np.arange(0,ny+1,1))
    plt.grid()
    plt.ylim((0,ny))
    plt.xlim((0,nx))

    for i in range(n_rows):
        for j in range(n_cols):
            if op_act[i,j]==0:
                plt.arrow(j+0.5,edge-i,0,scale,width=0.1, head_width=0.2, head_length=0.1,fc='g', ec='g')
            elif op_act[i,j]==1:
                plt.arrow(j+0.5,edge-i,0,-scale,width=0.1, head_width=0.2, head_length=0.1,fc='c', ec='c')
            elif op_act[i,j]==2:
                plt.arrow(j+0.5,edge-i,-scale,0,width=0.1, head_width=0.2, head_length=0.1,fc='b', ec='b')
            elif op_act[i,j]==3:
                plt.arrow(j+0.5,edge-i,scale,0,width=0.1, head_width=0.2, head_length=0.1,fc='r', ec='r')

    plt.annotate('S',(0.3,0.3),fontsize=20)
    plt.annotate('G',(11.3,0.3),fontsize=20)
    plt.title('$\pi_*$ of '+alg)
    plt.savefig(alg+'_oppi_cliffwalk.png',dpi=350)
    plt.close()

plot_heat(Q_sarsa,'sarsa')
plot_heat(Q_q,'ql')
plot_oppi(Q_sarsa,'sarsa')
plot_oppi(Q_q,'ql')
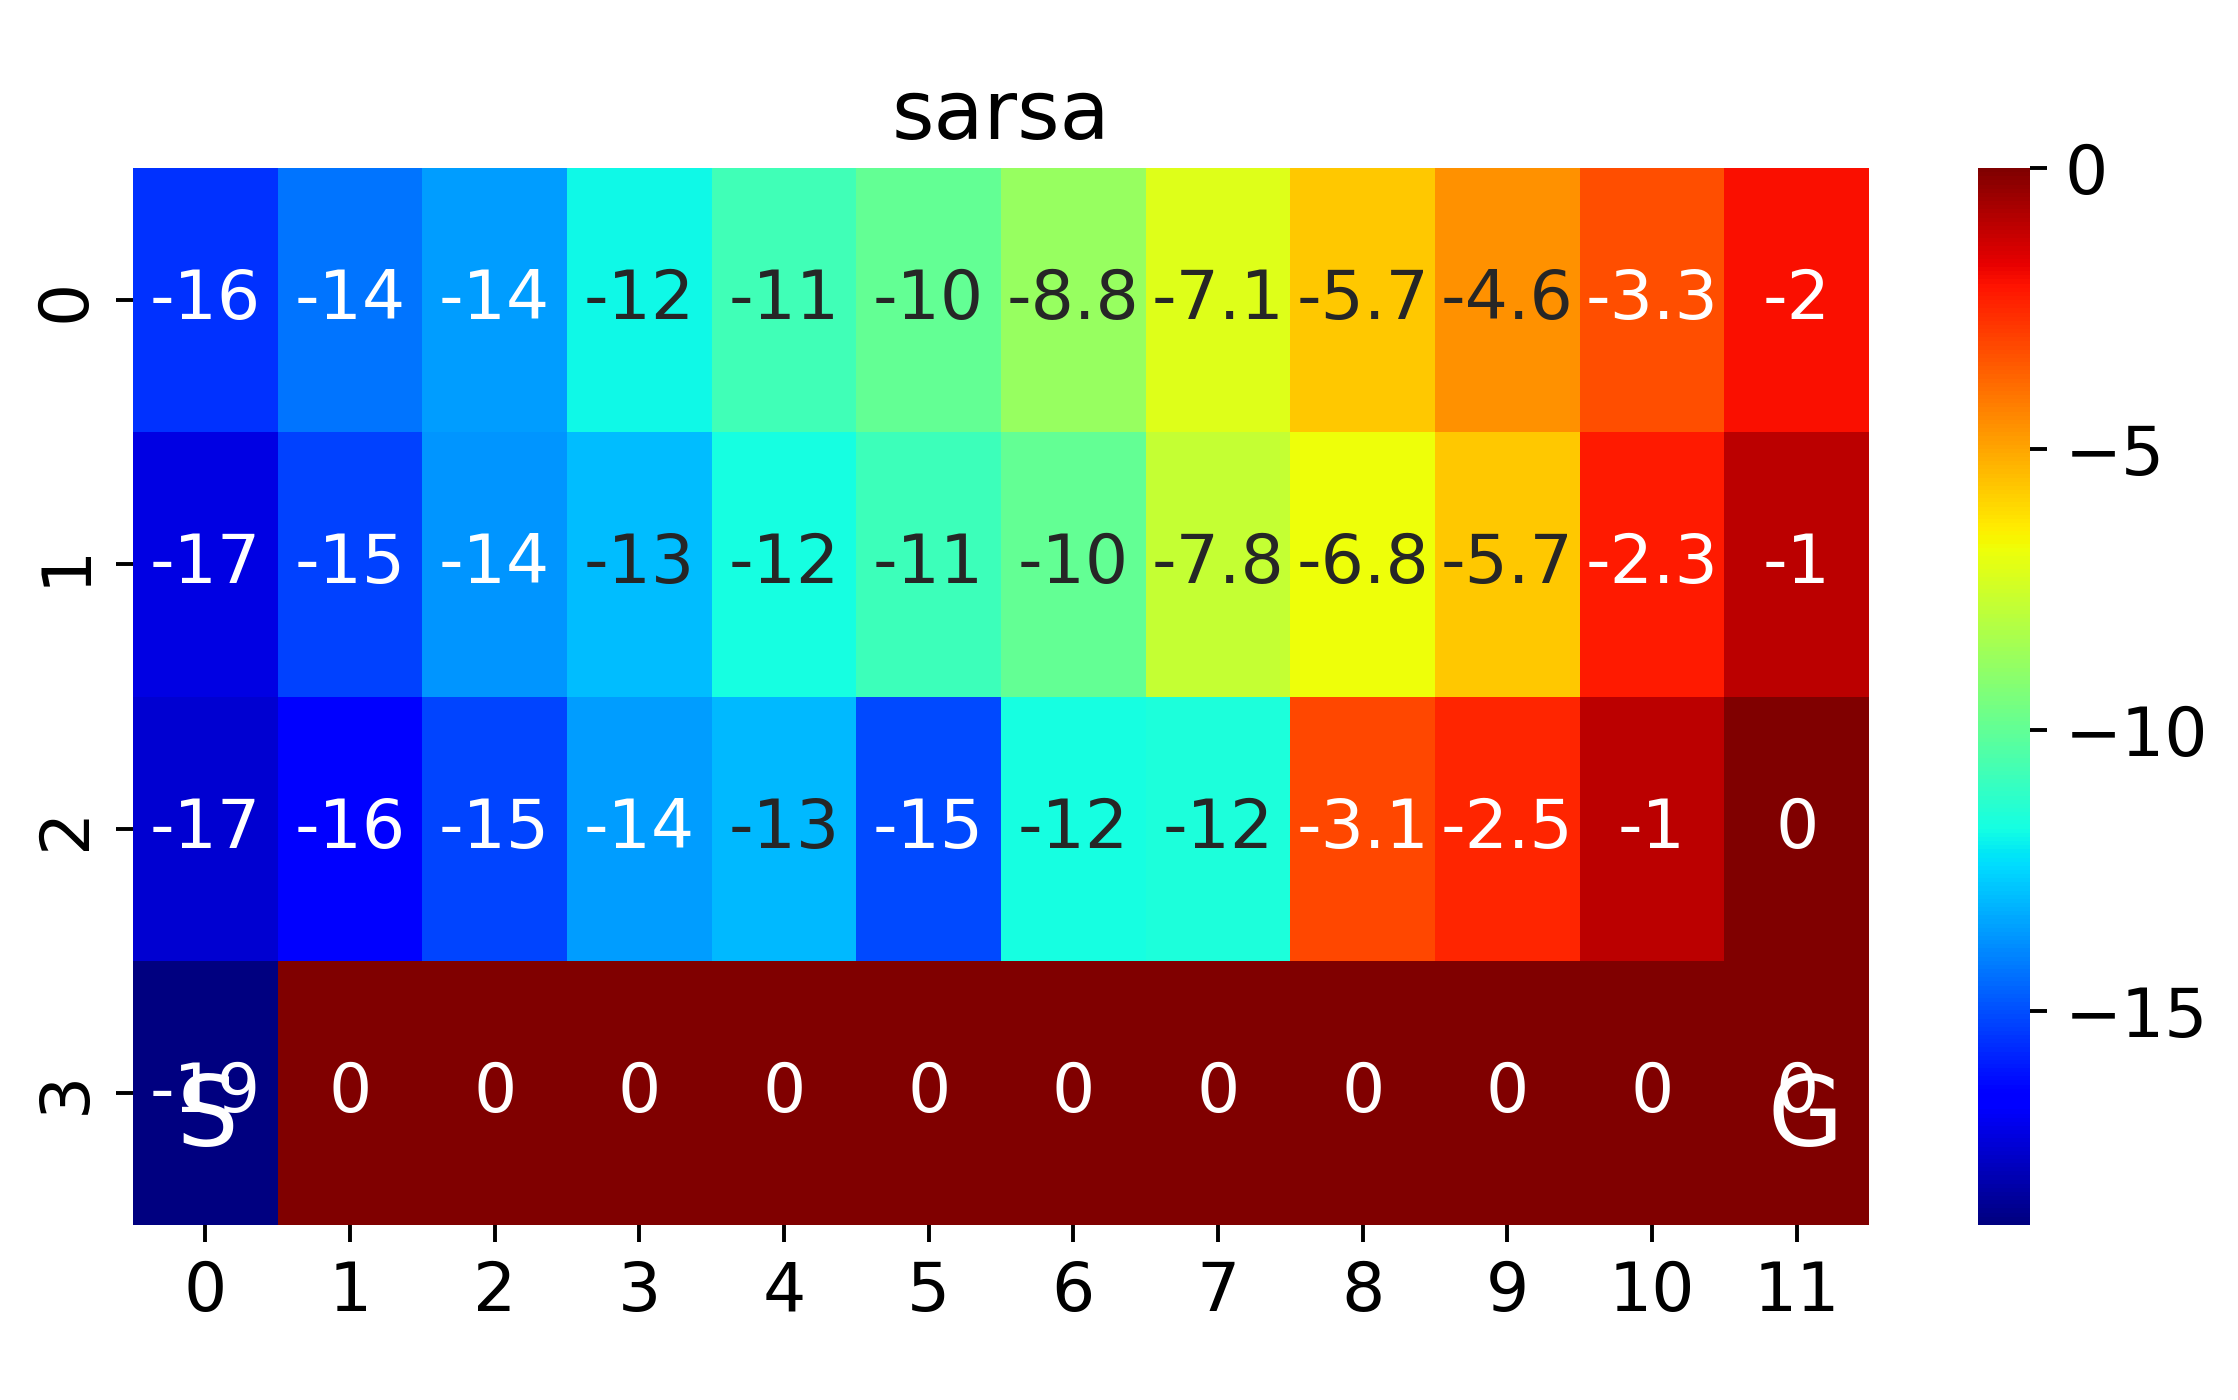
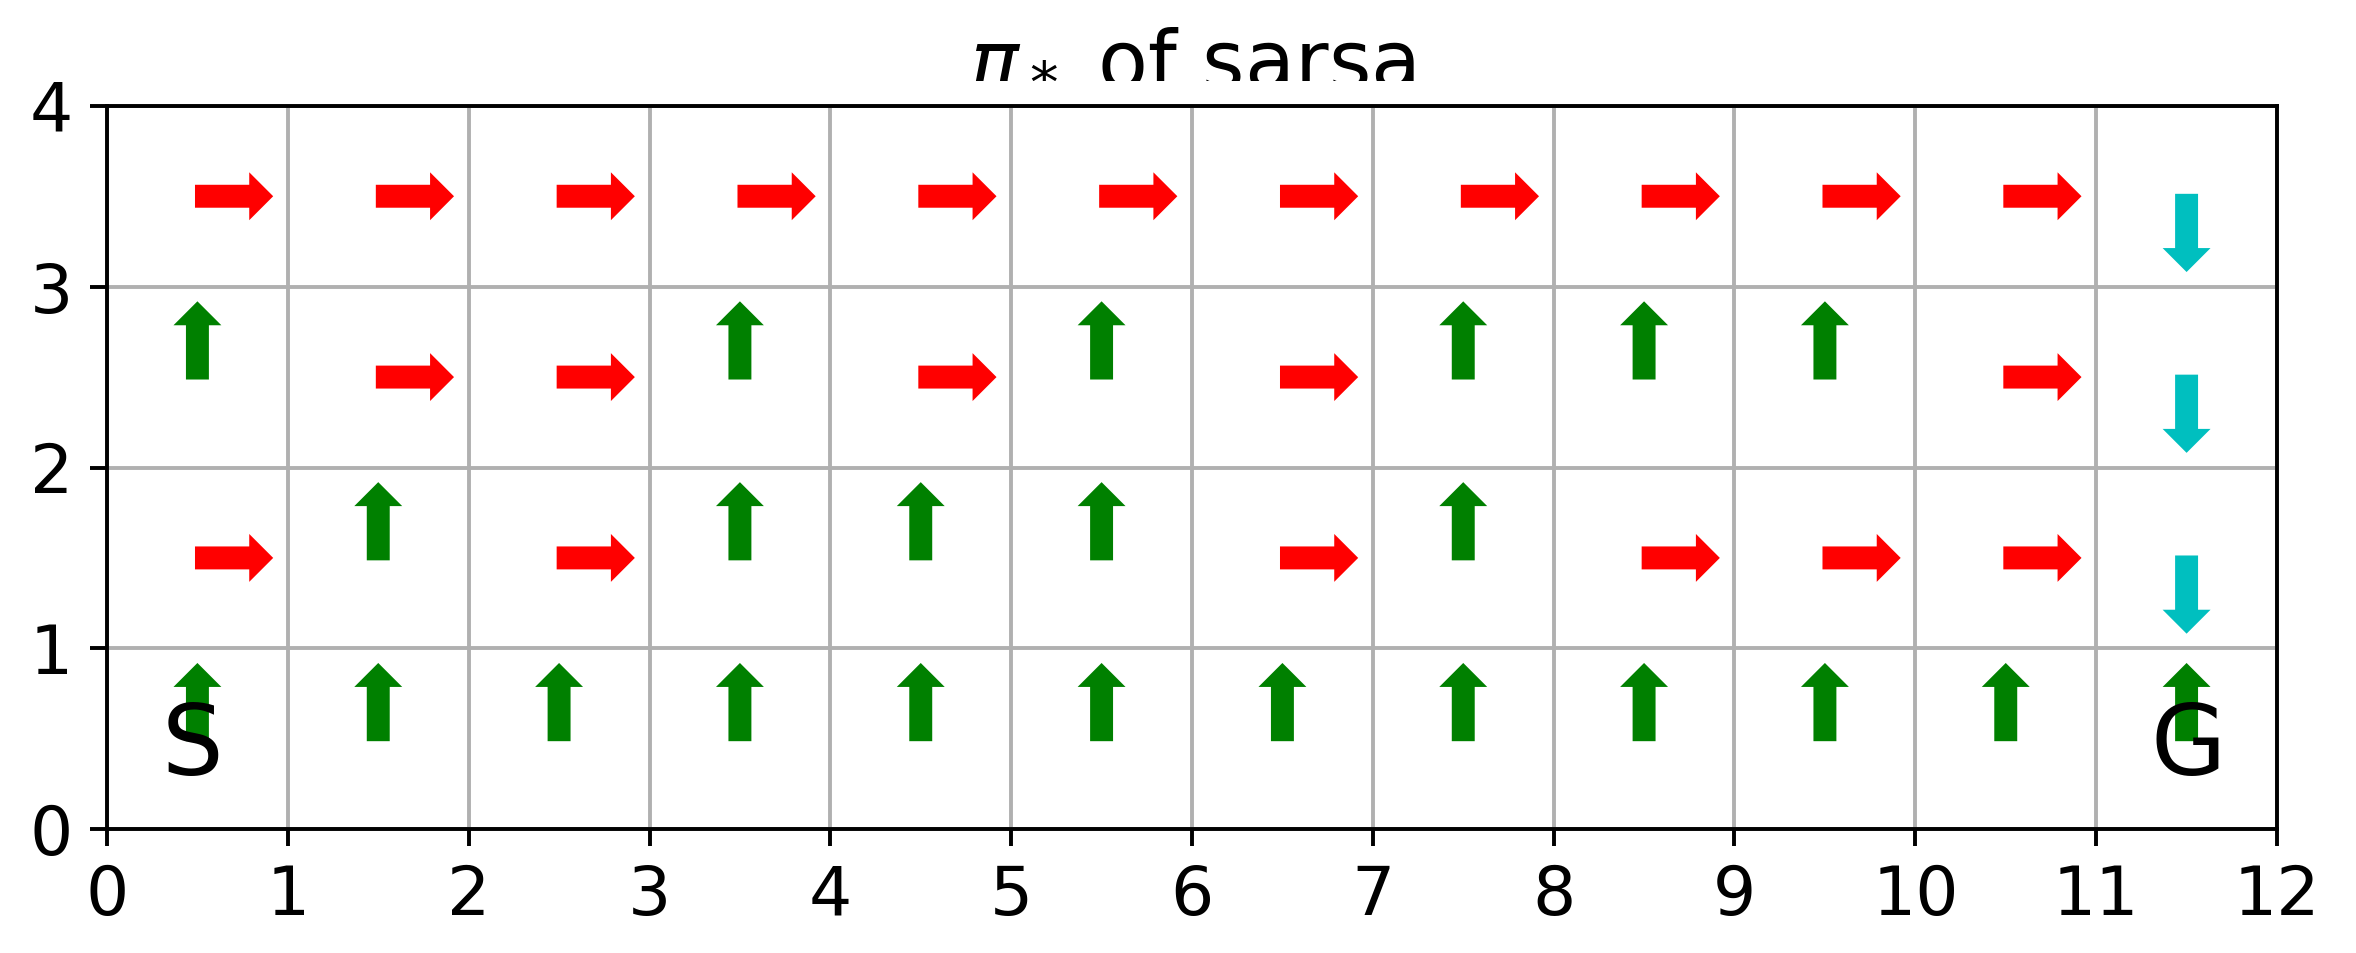
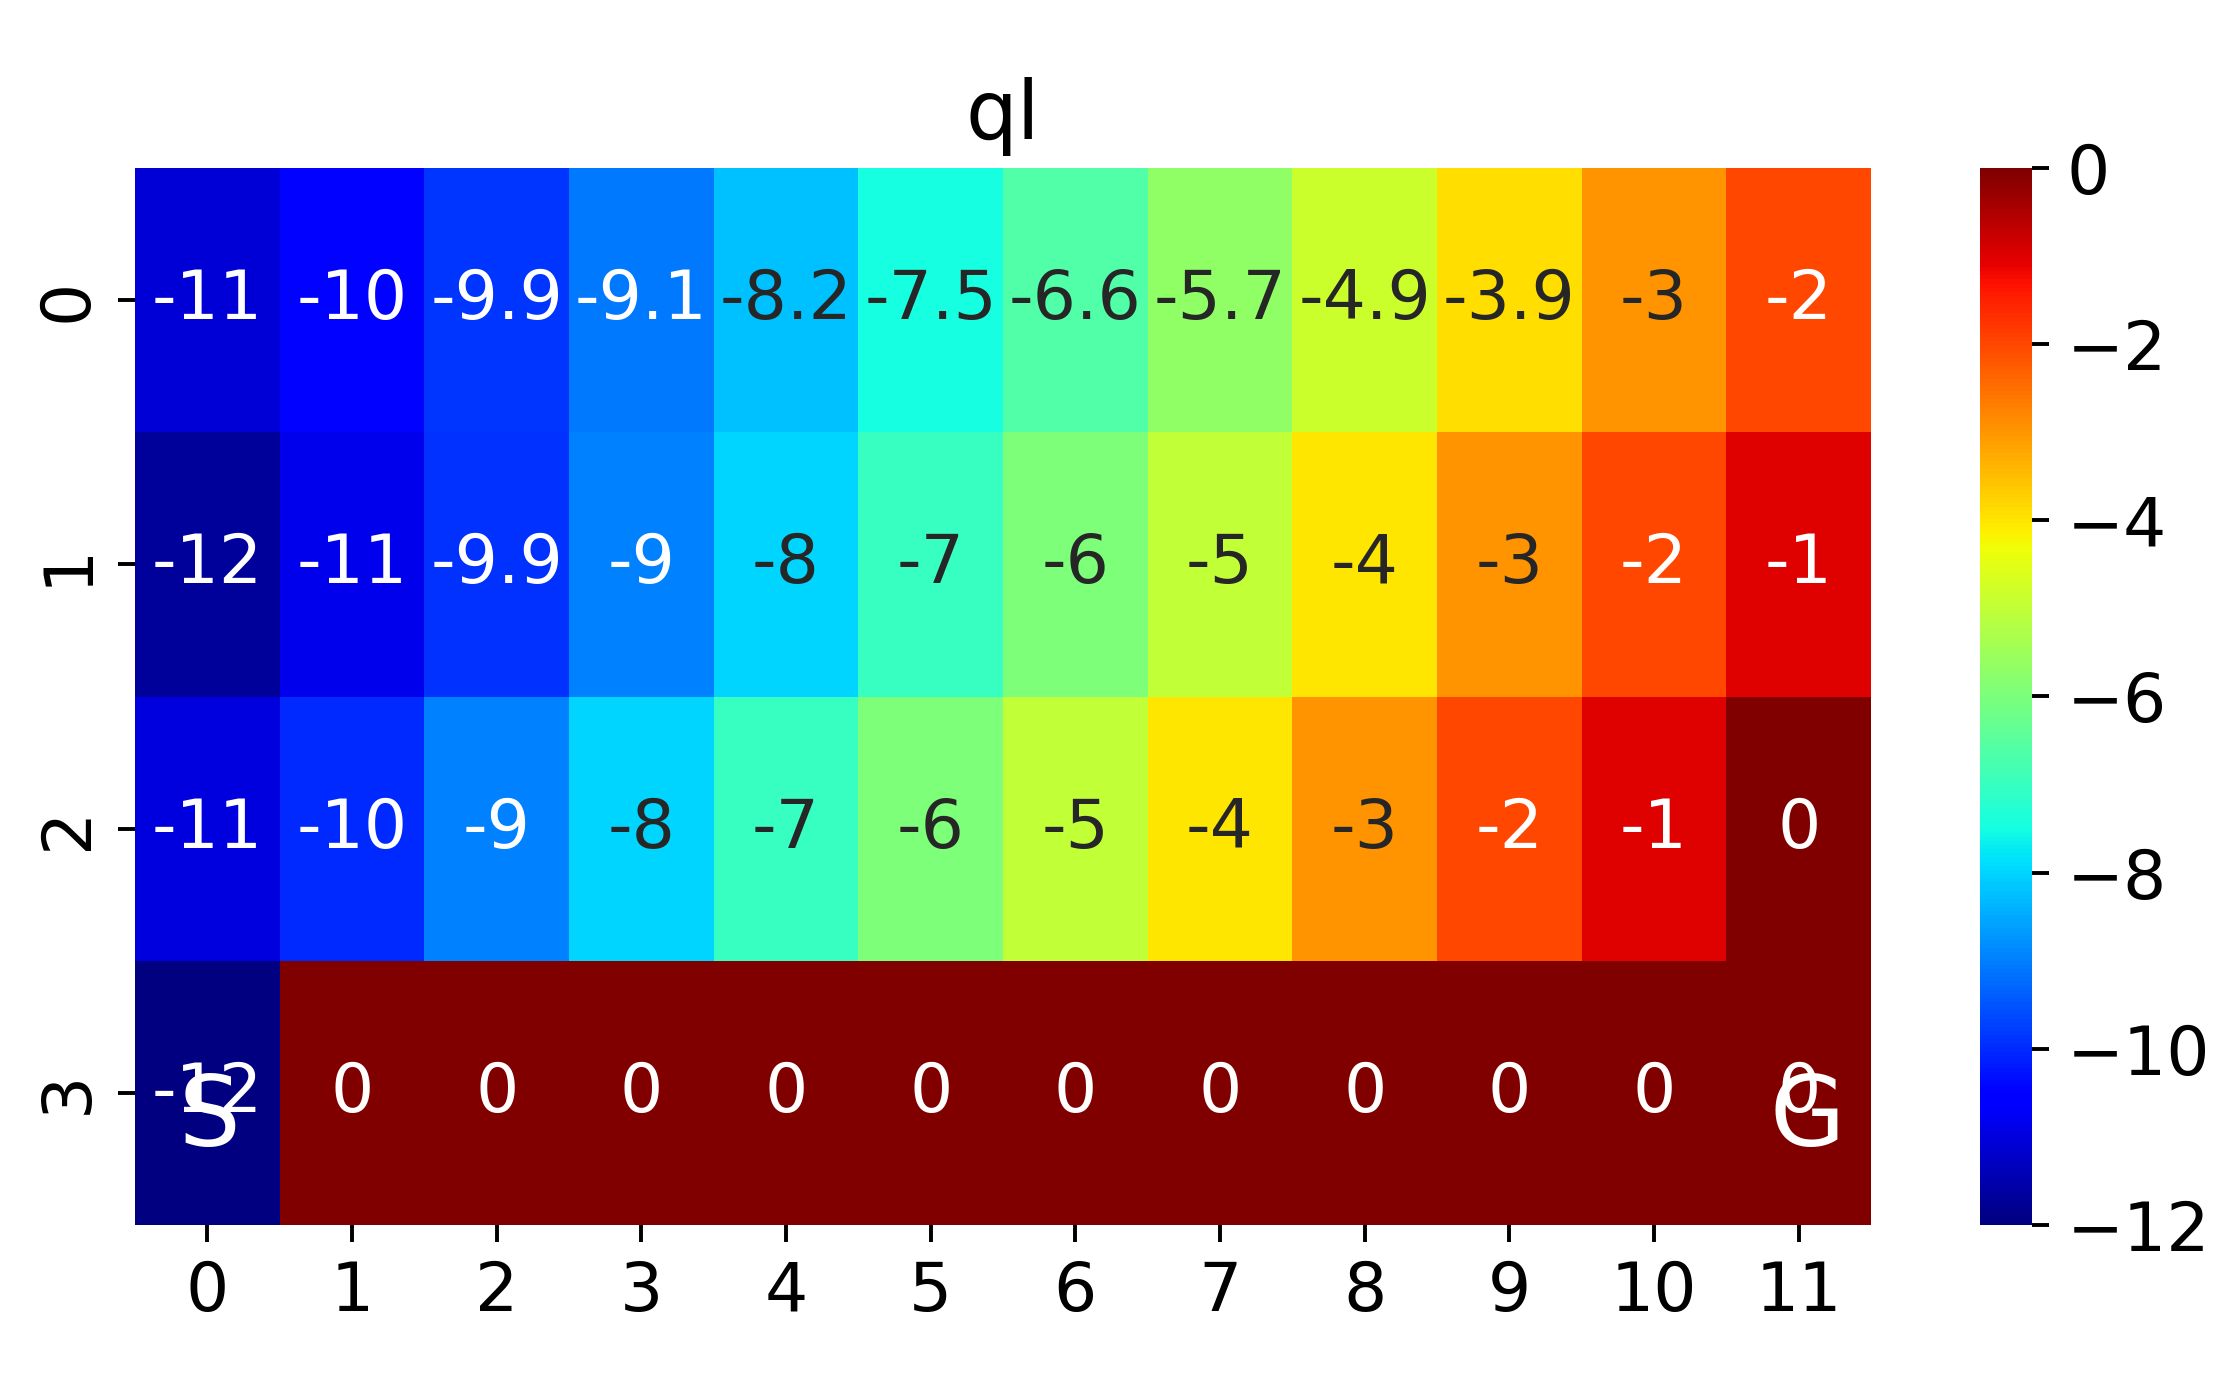
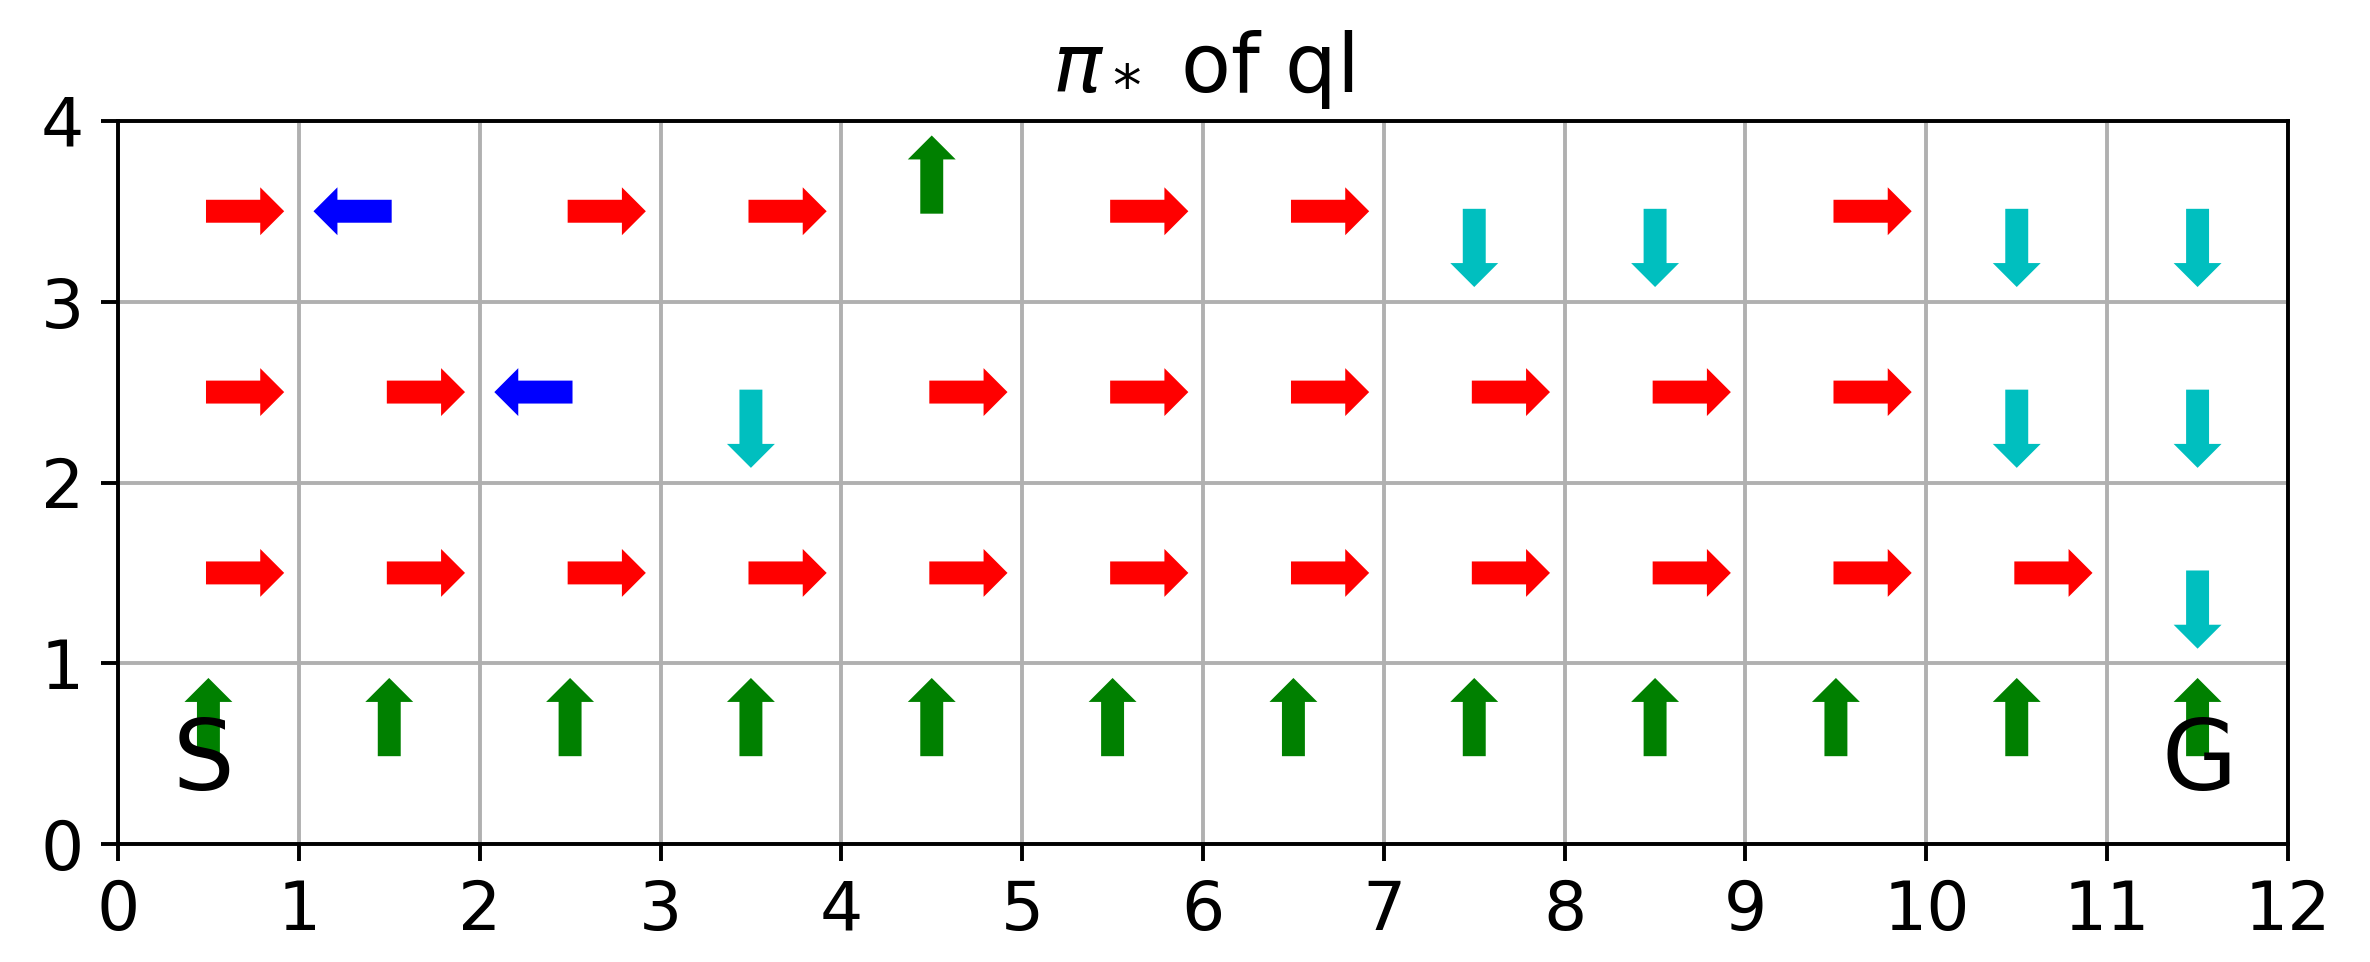
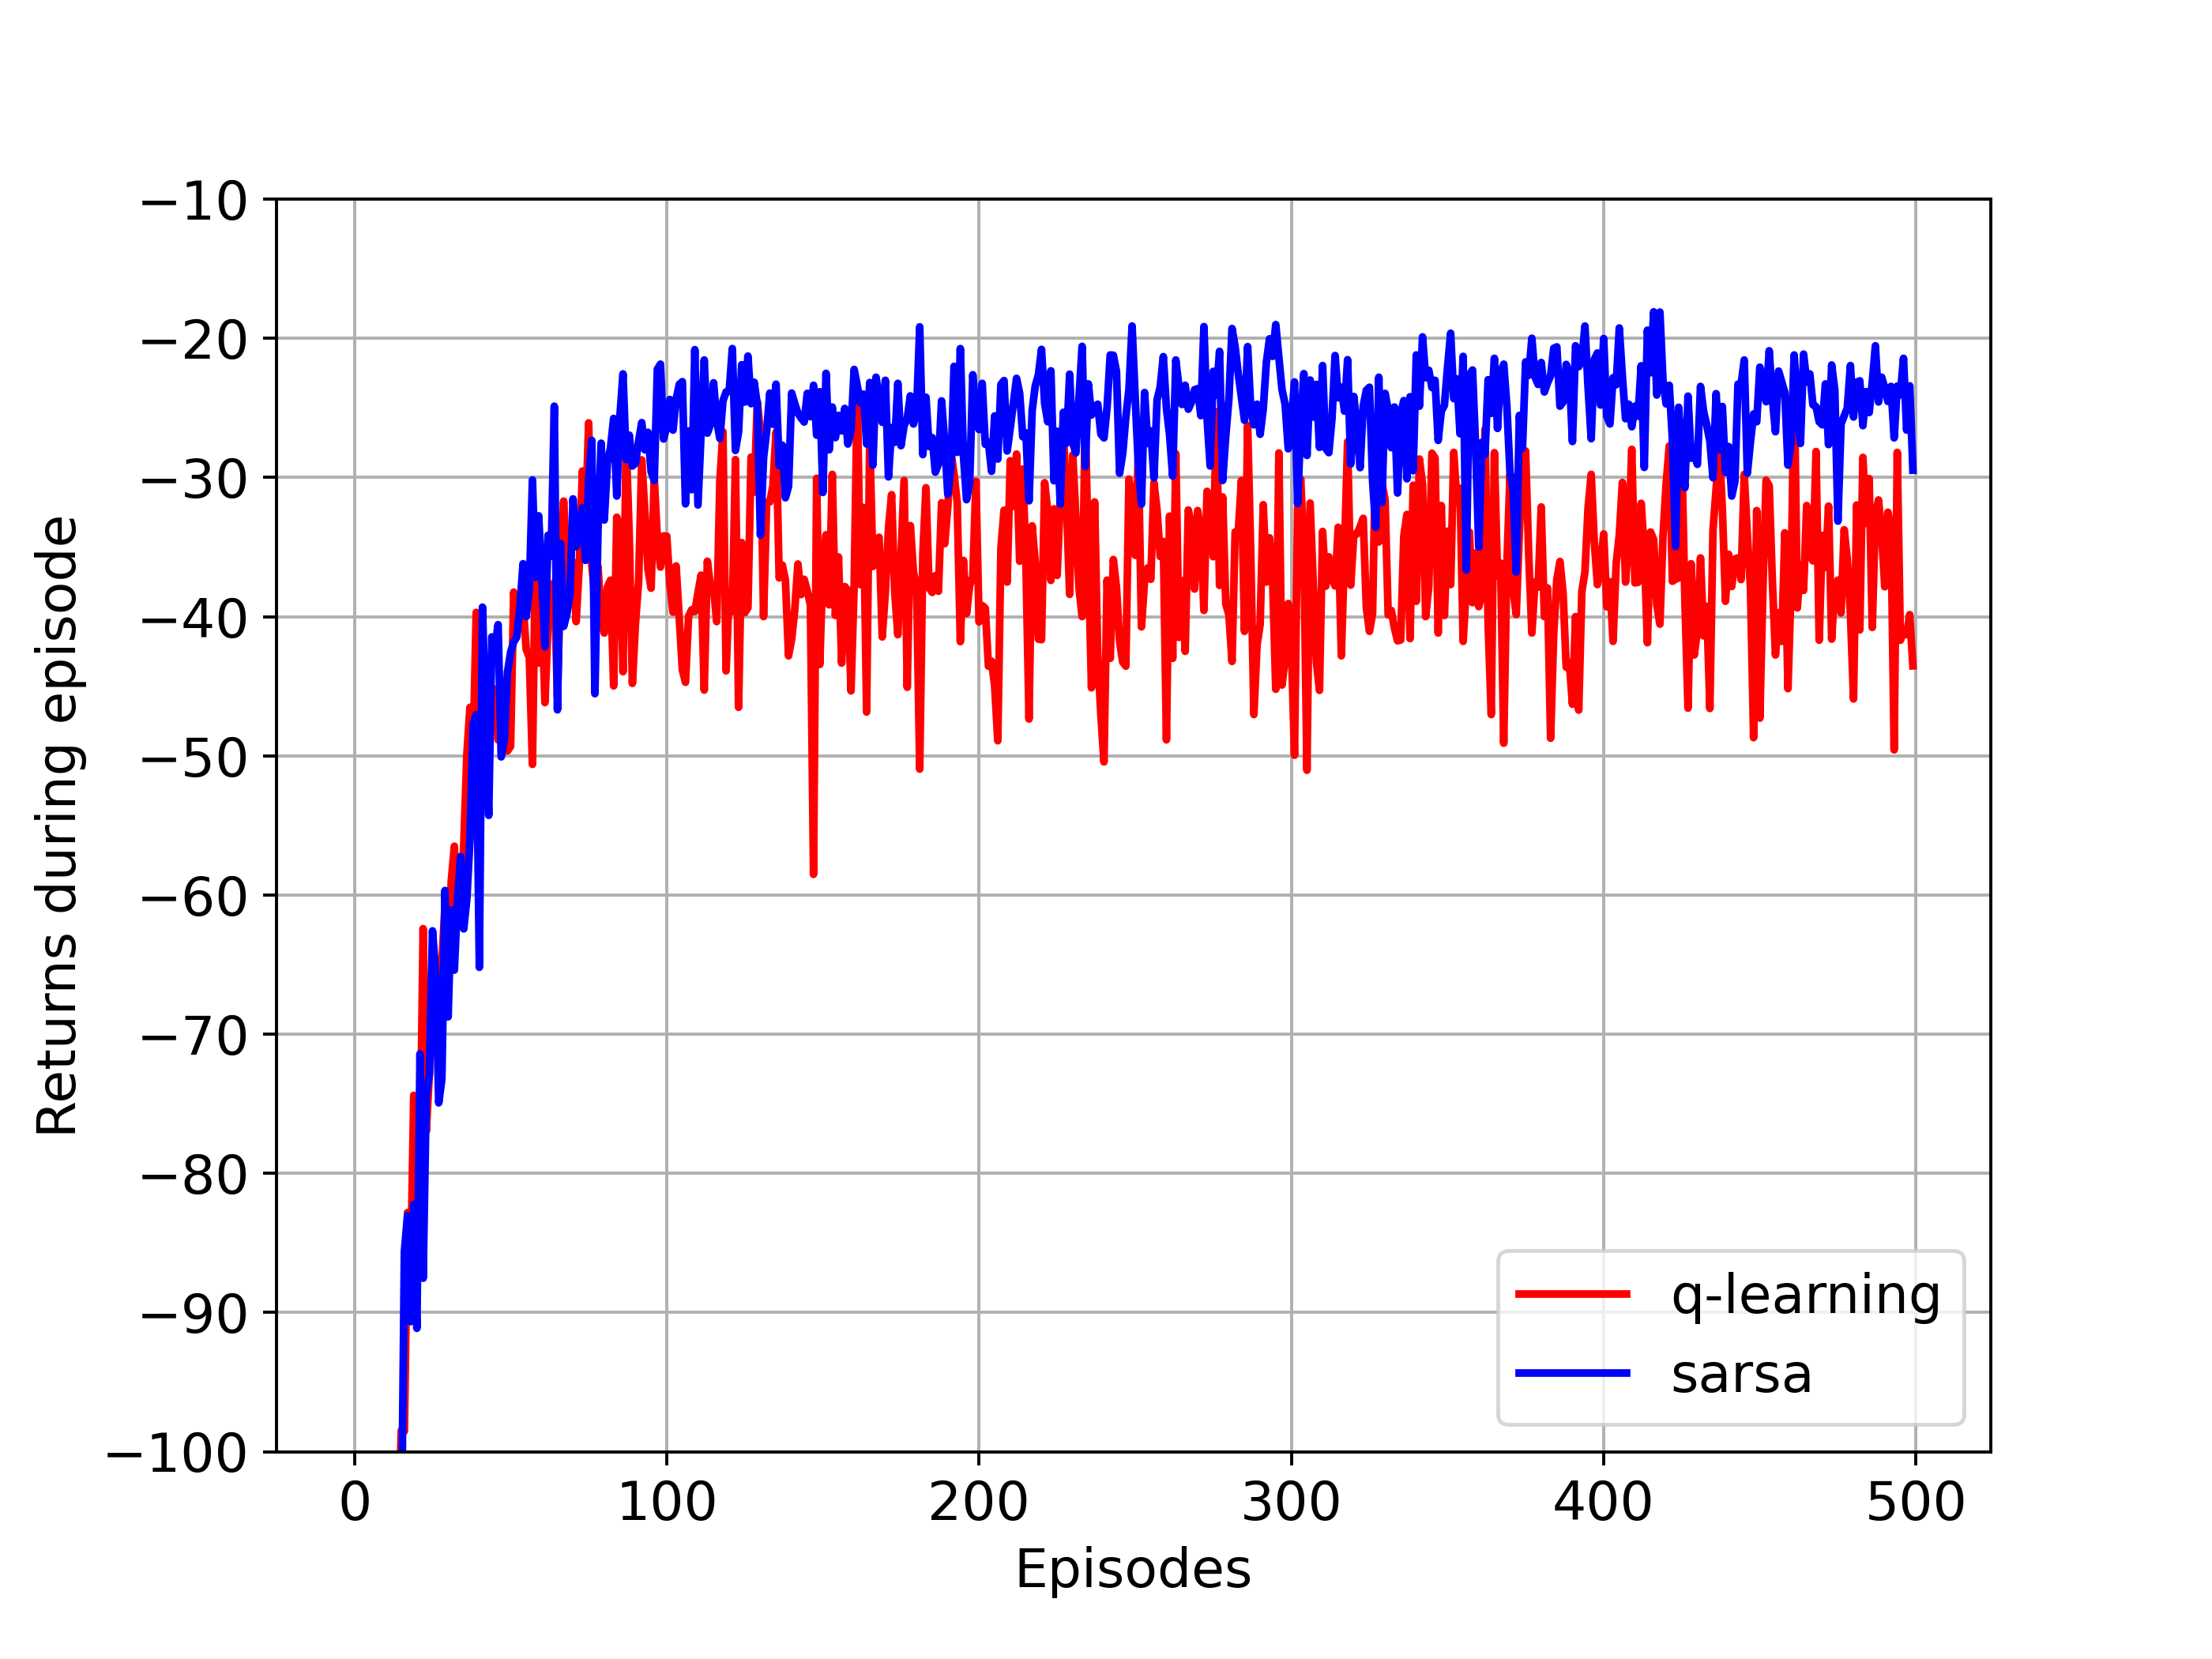
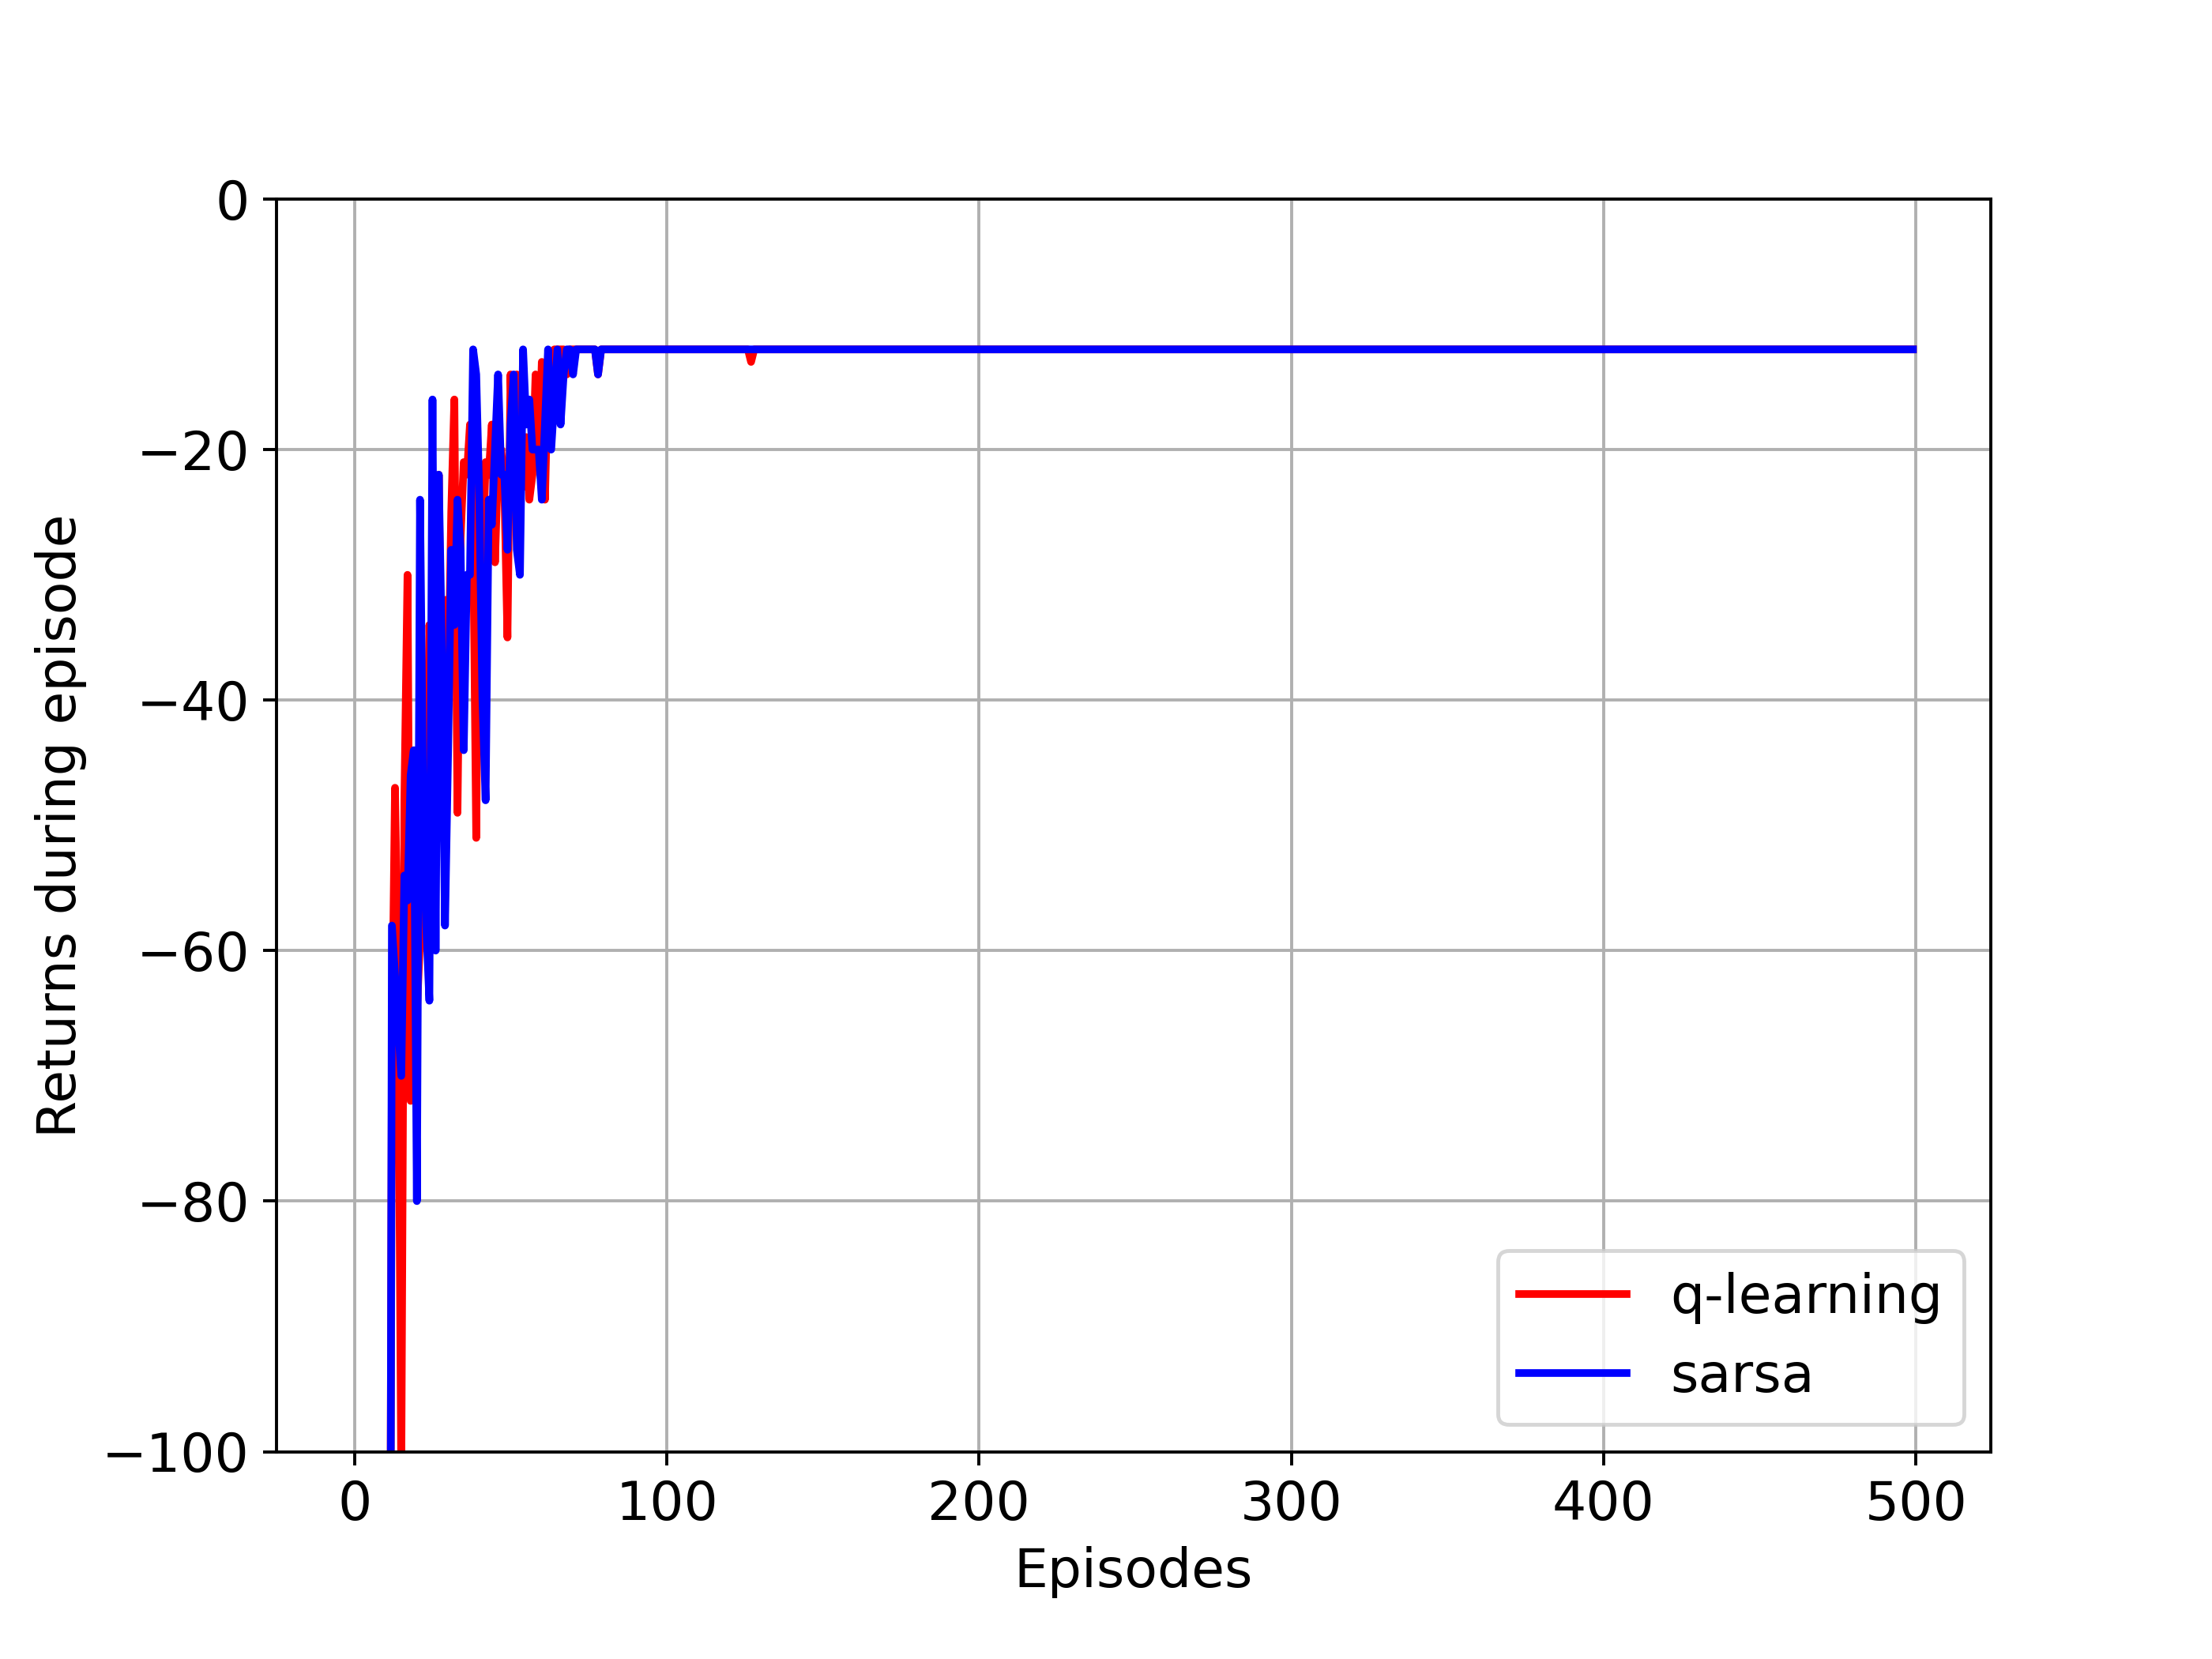
The above corresponds to figure in Example 6.6
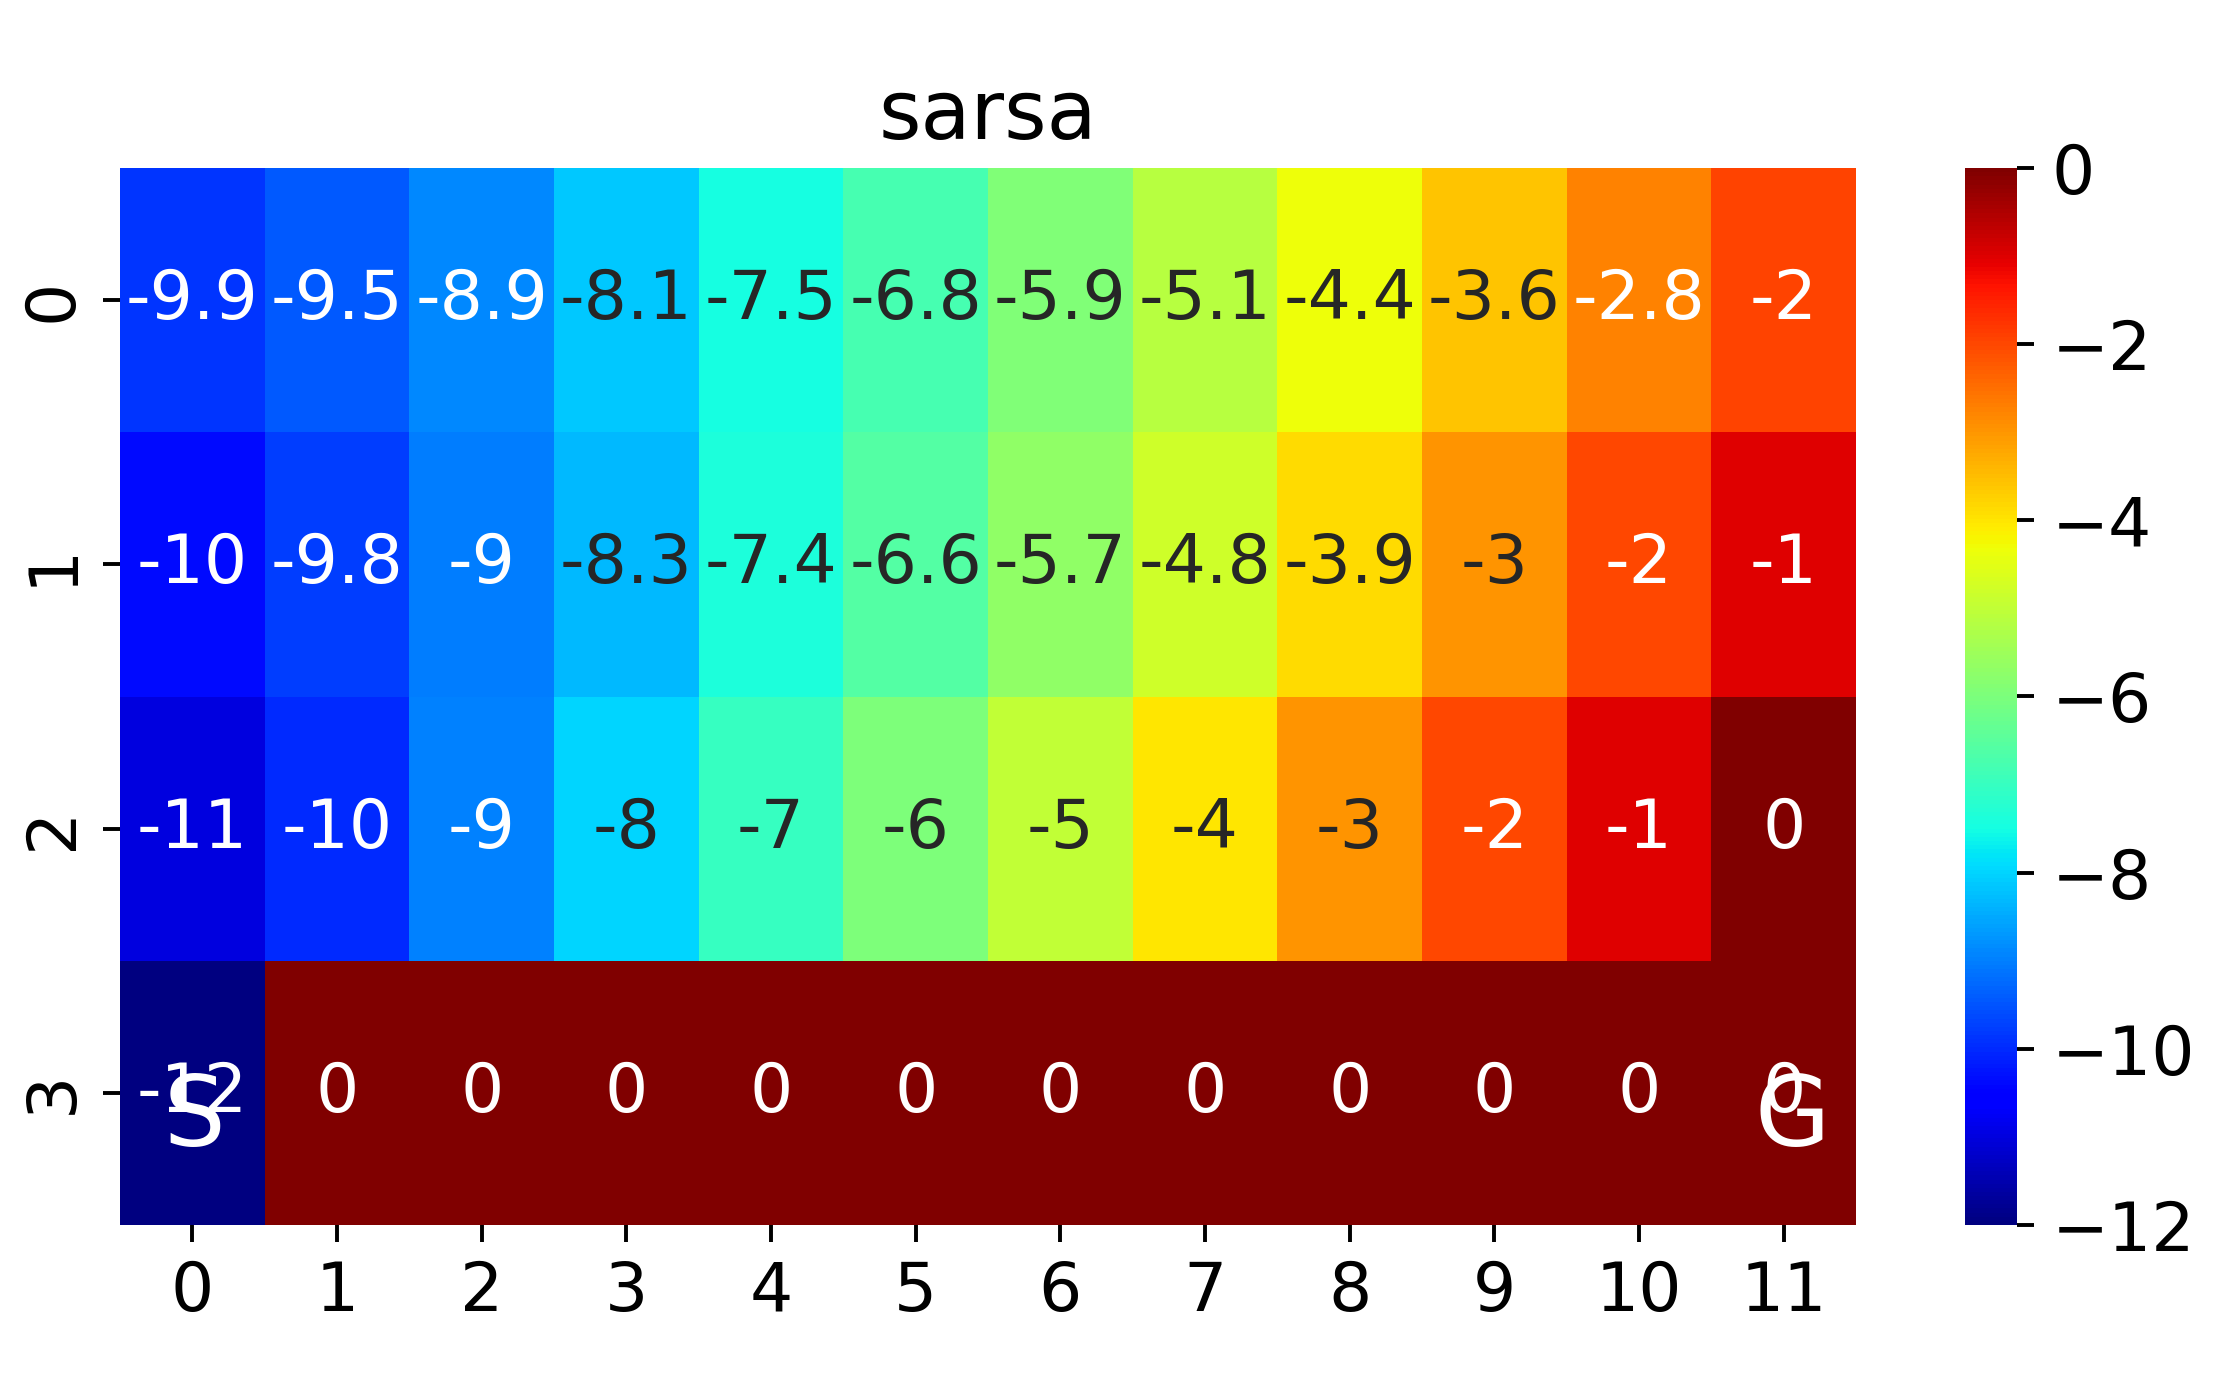
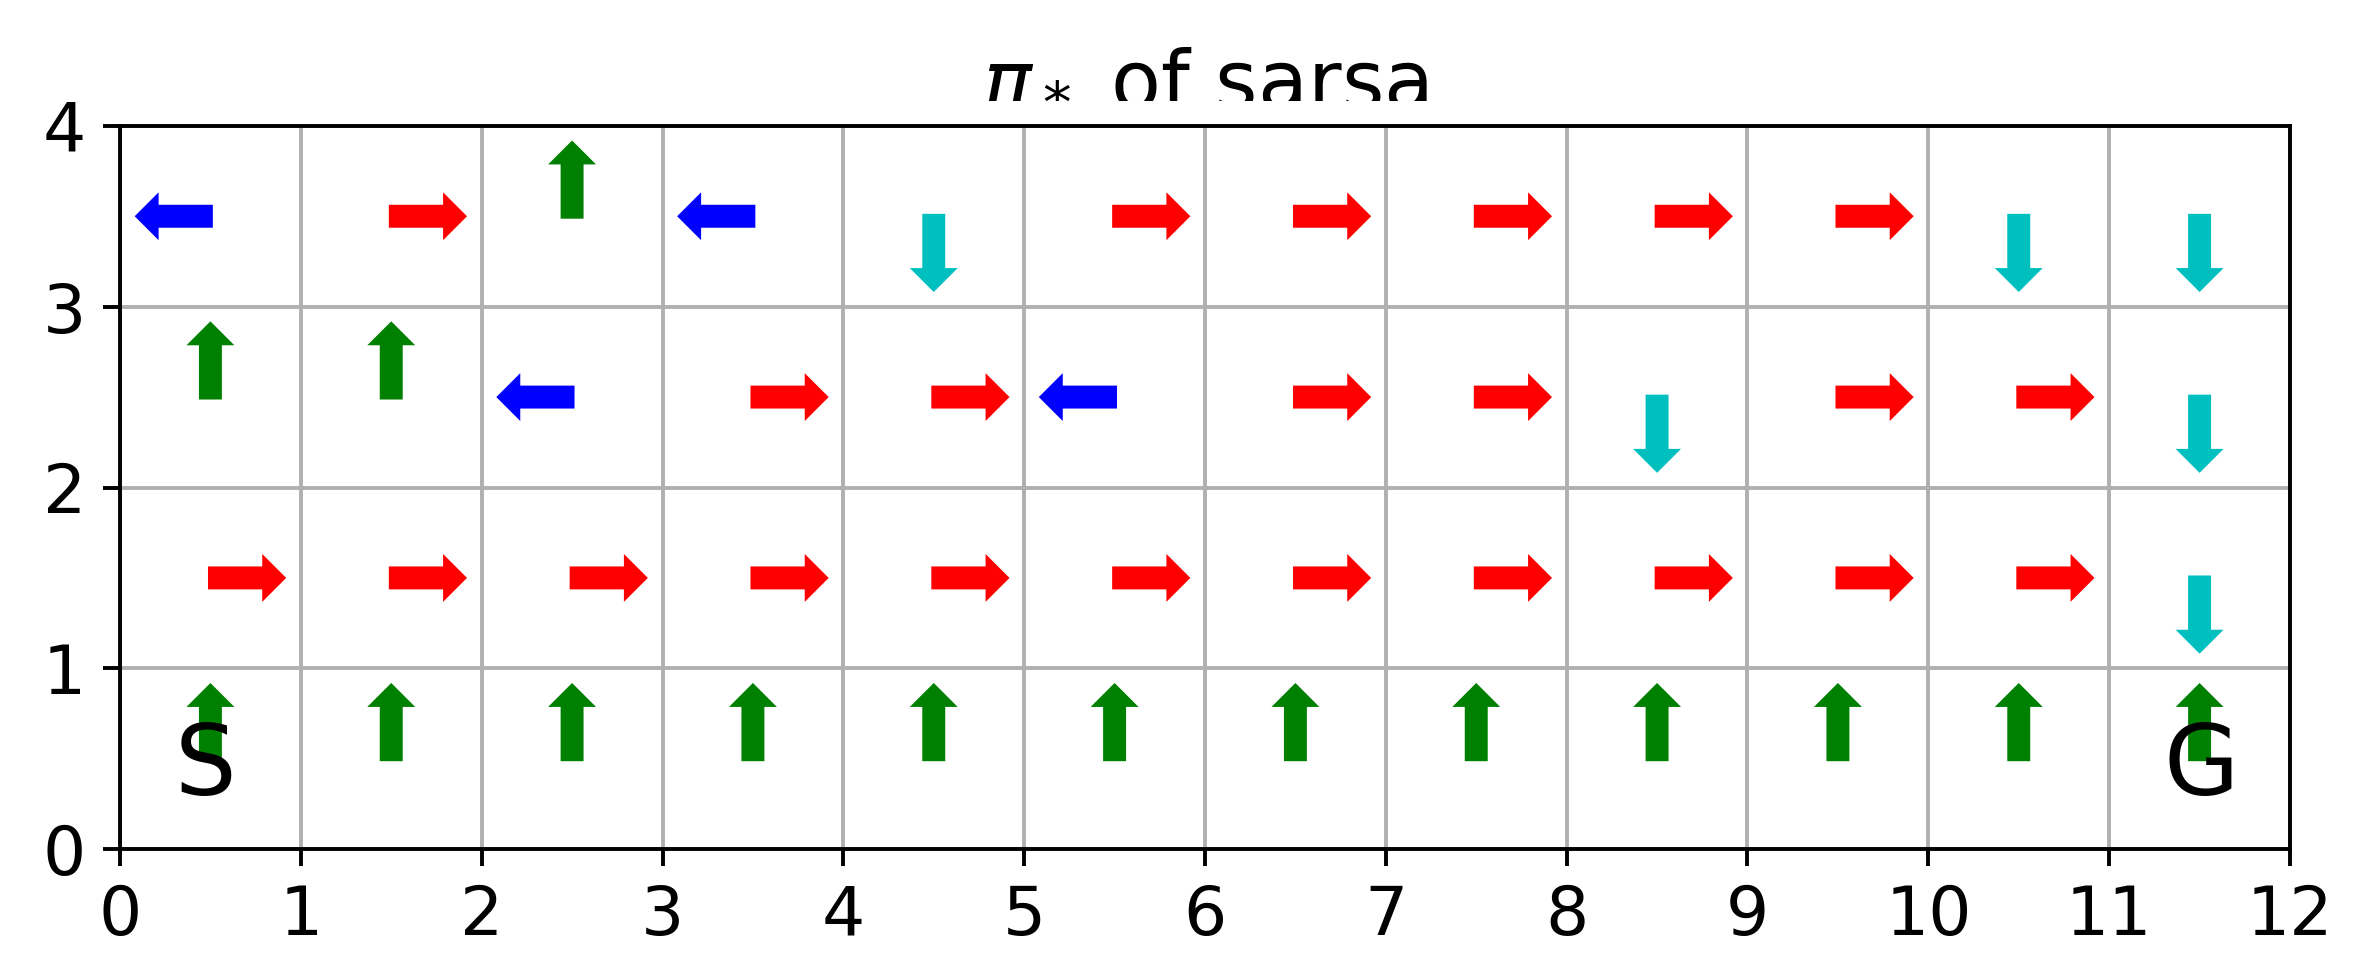
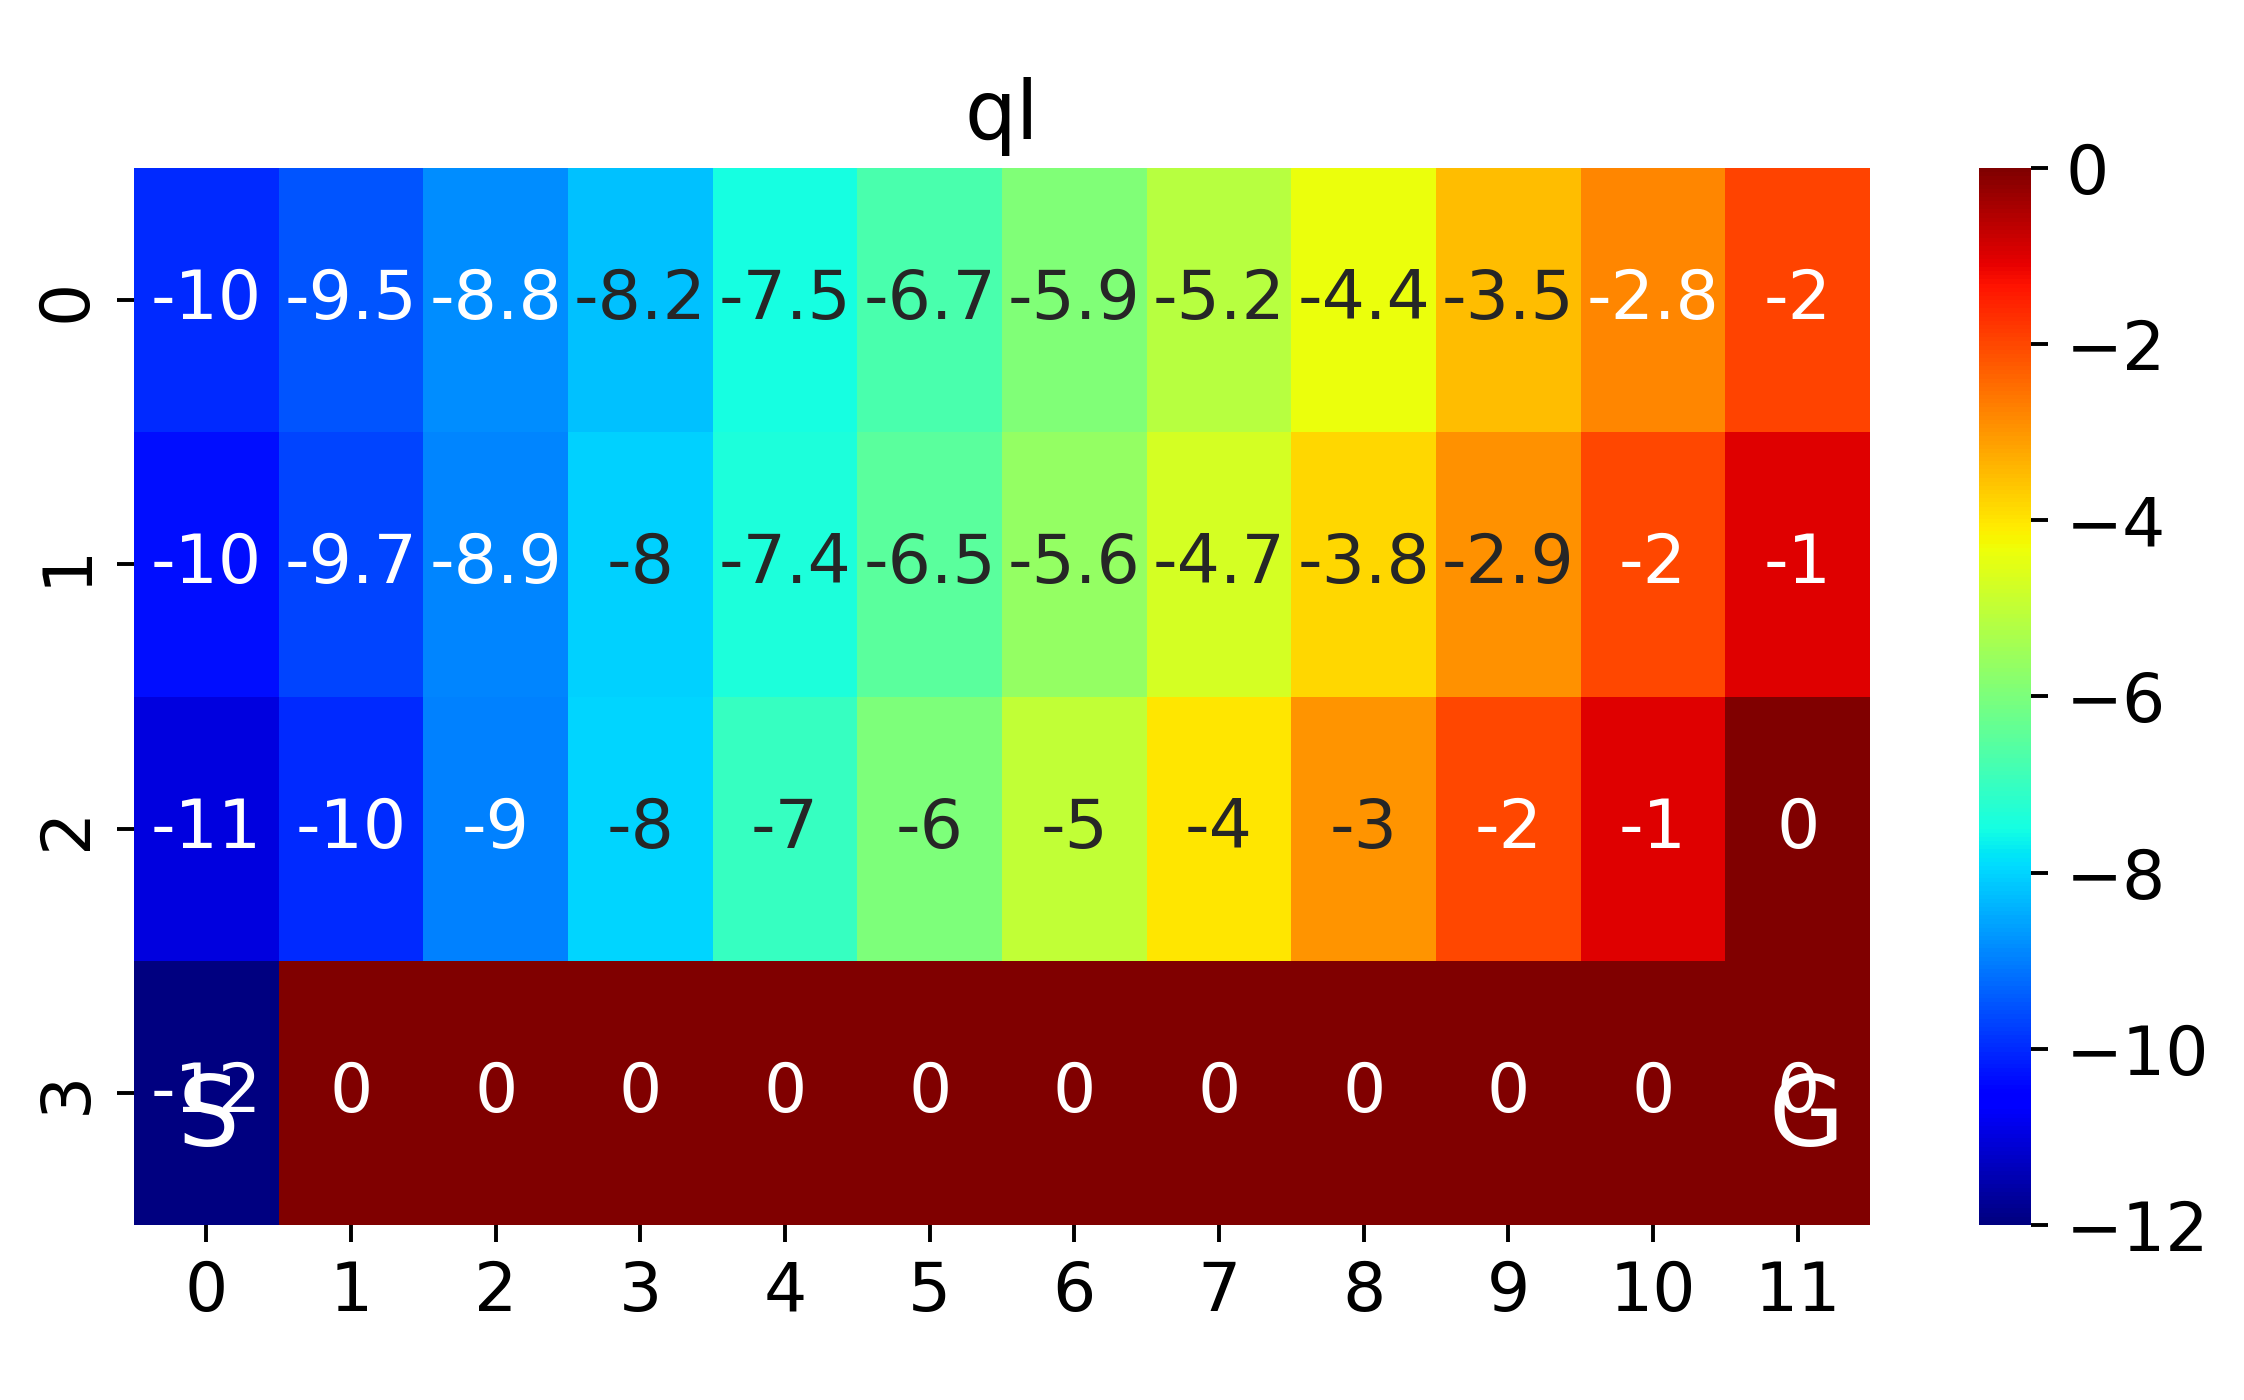
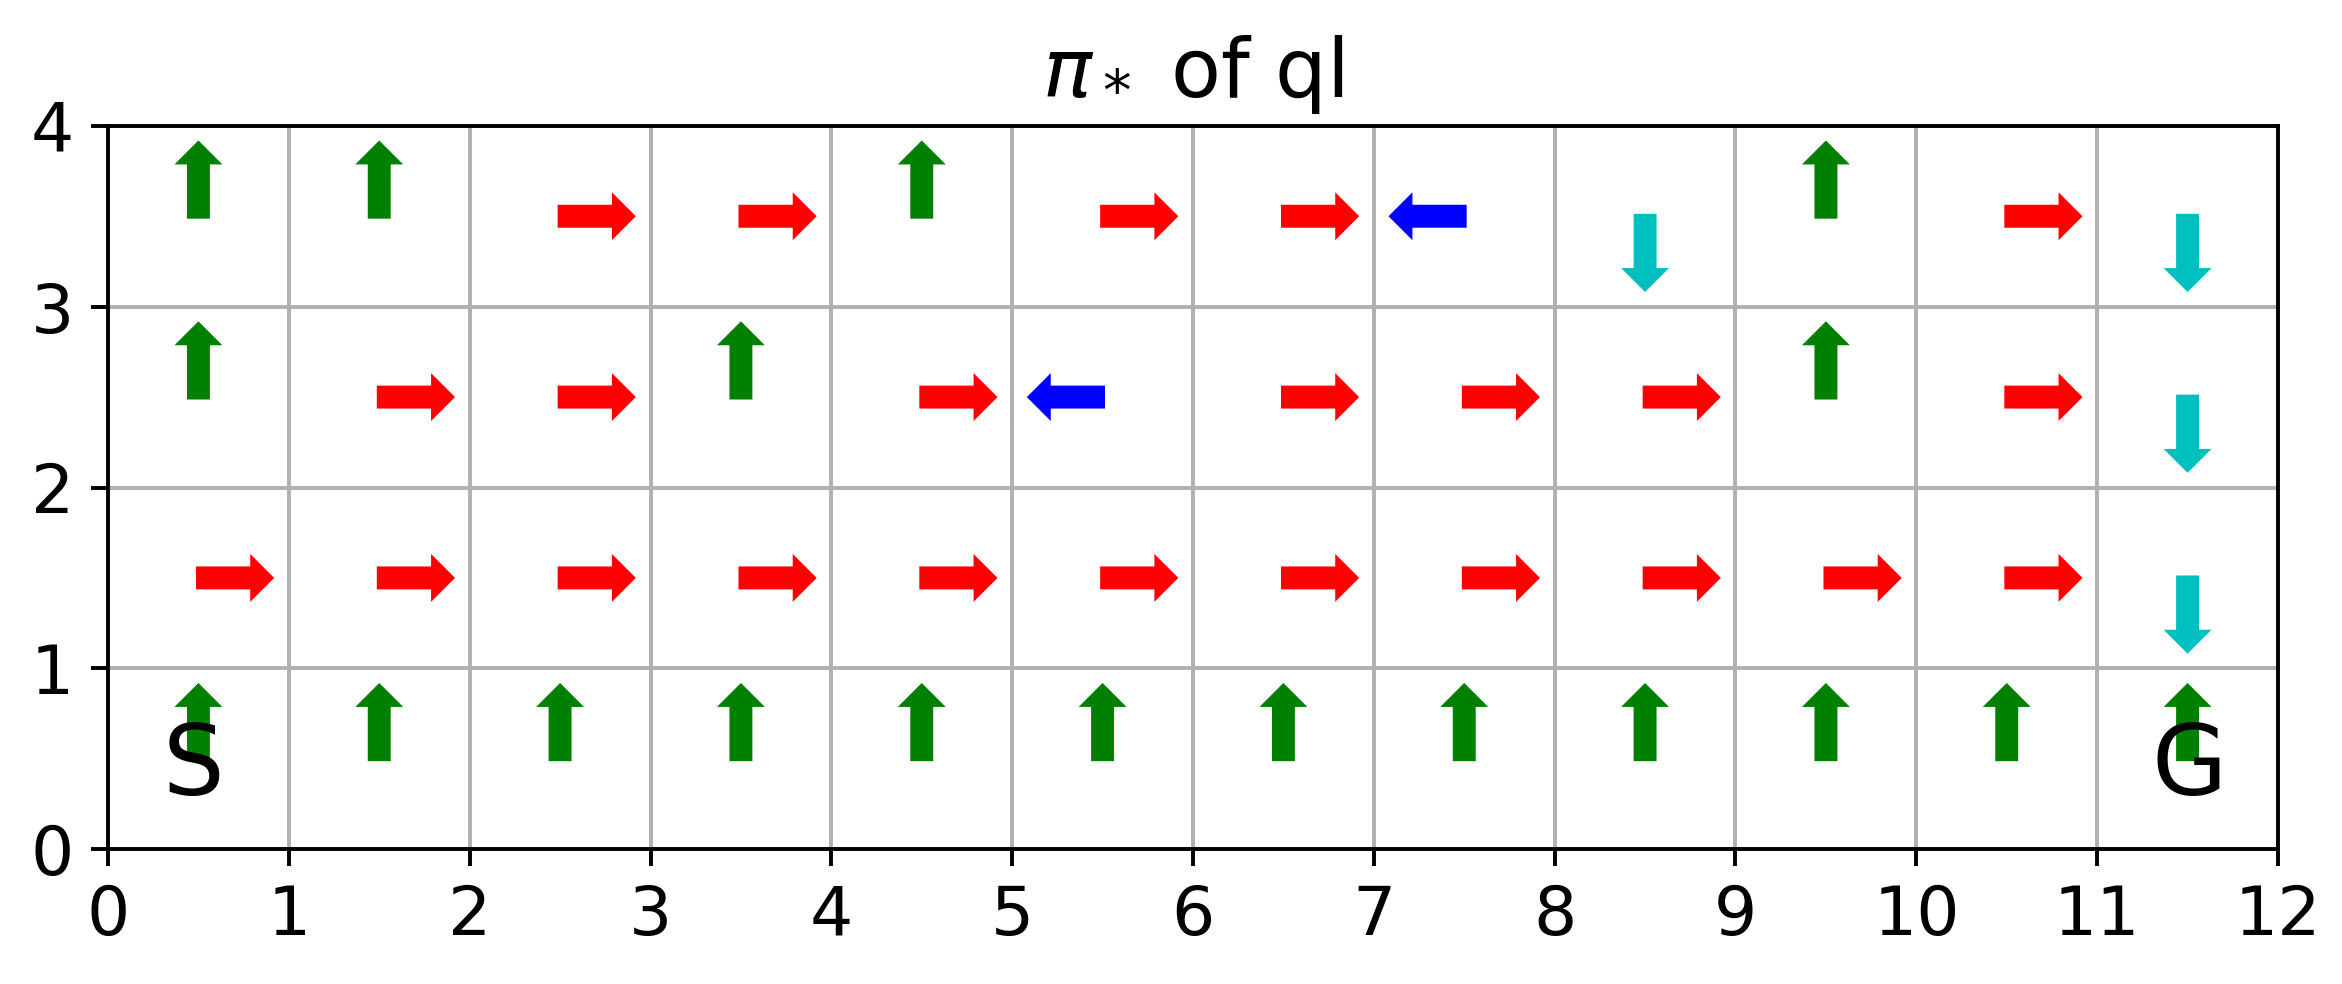
If we anneal \(\epsilon\) from 0.5 with decaying rate 0.99 per episode, we will have the value function and optimal policies as follows
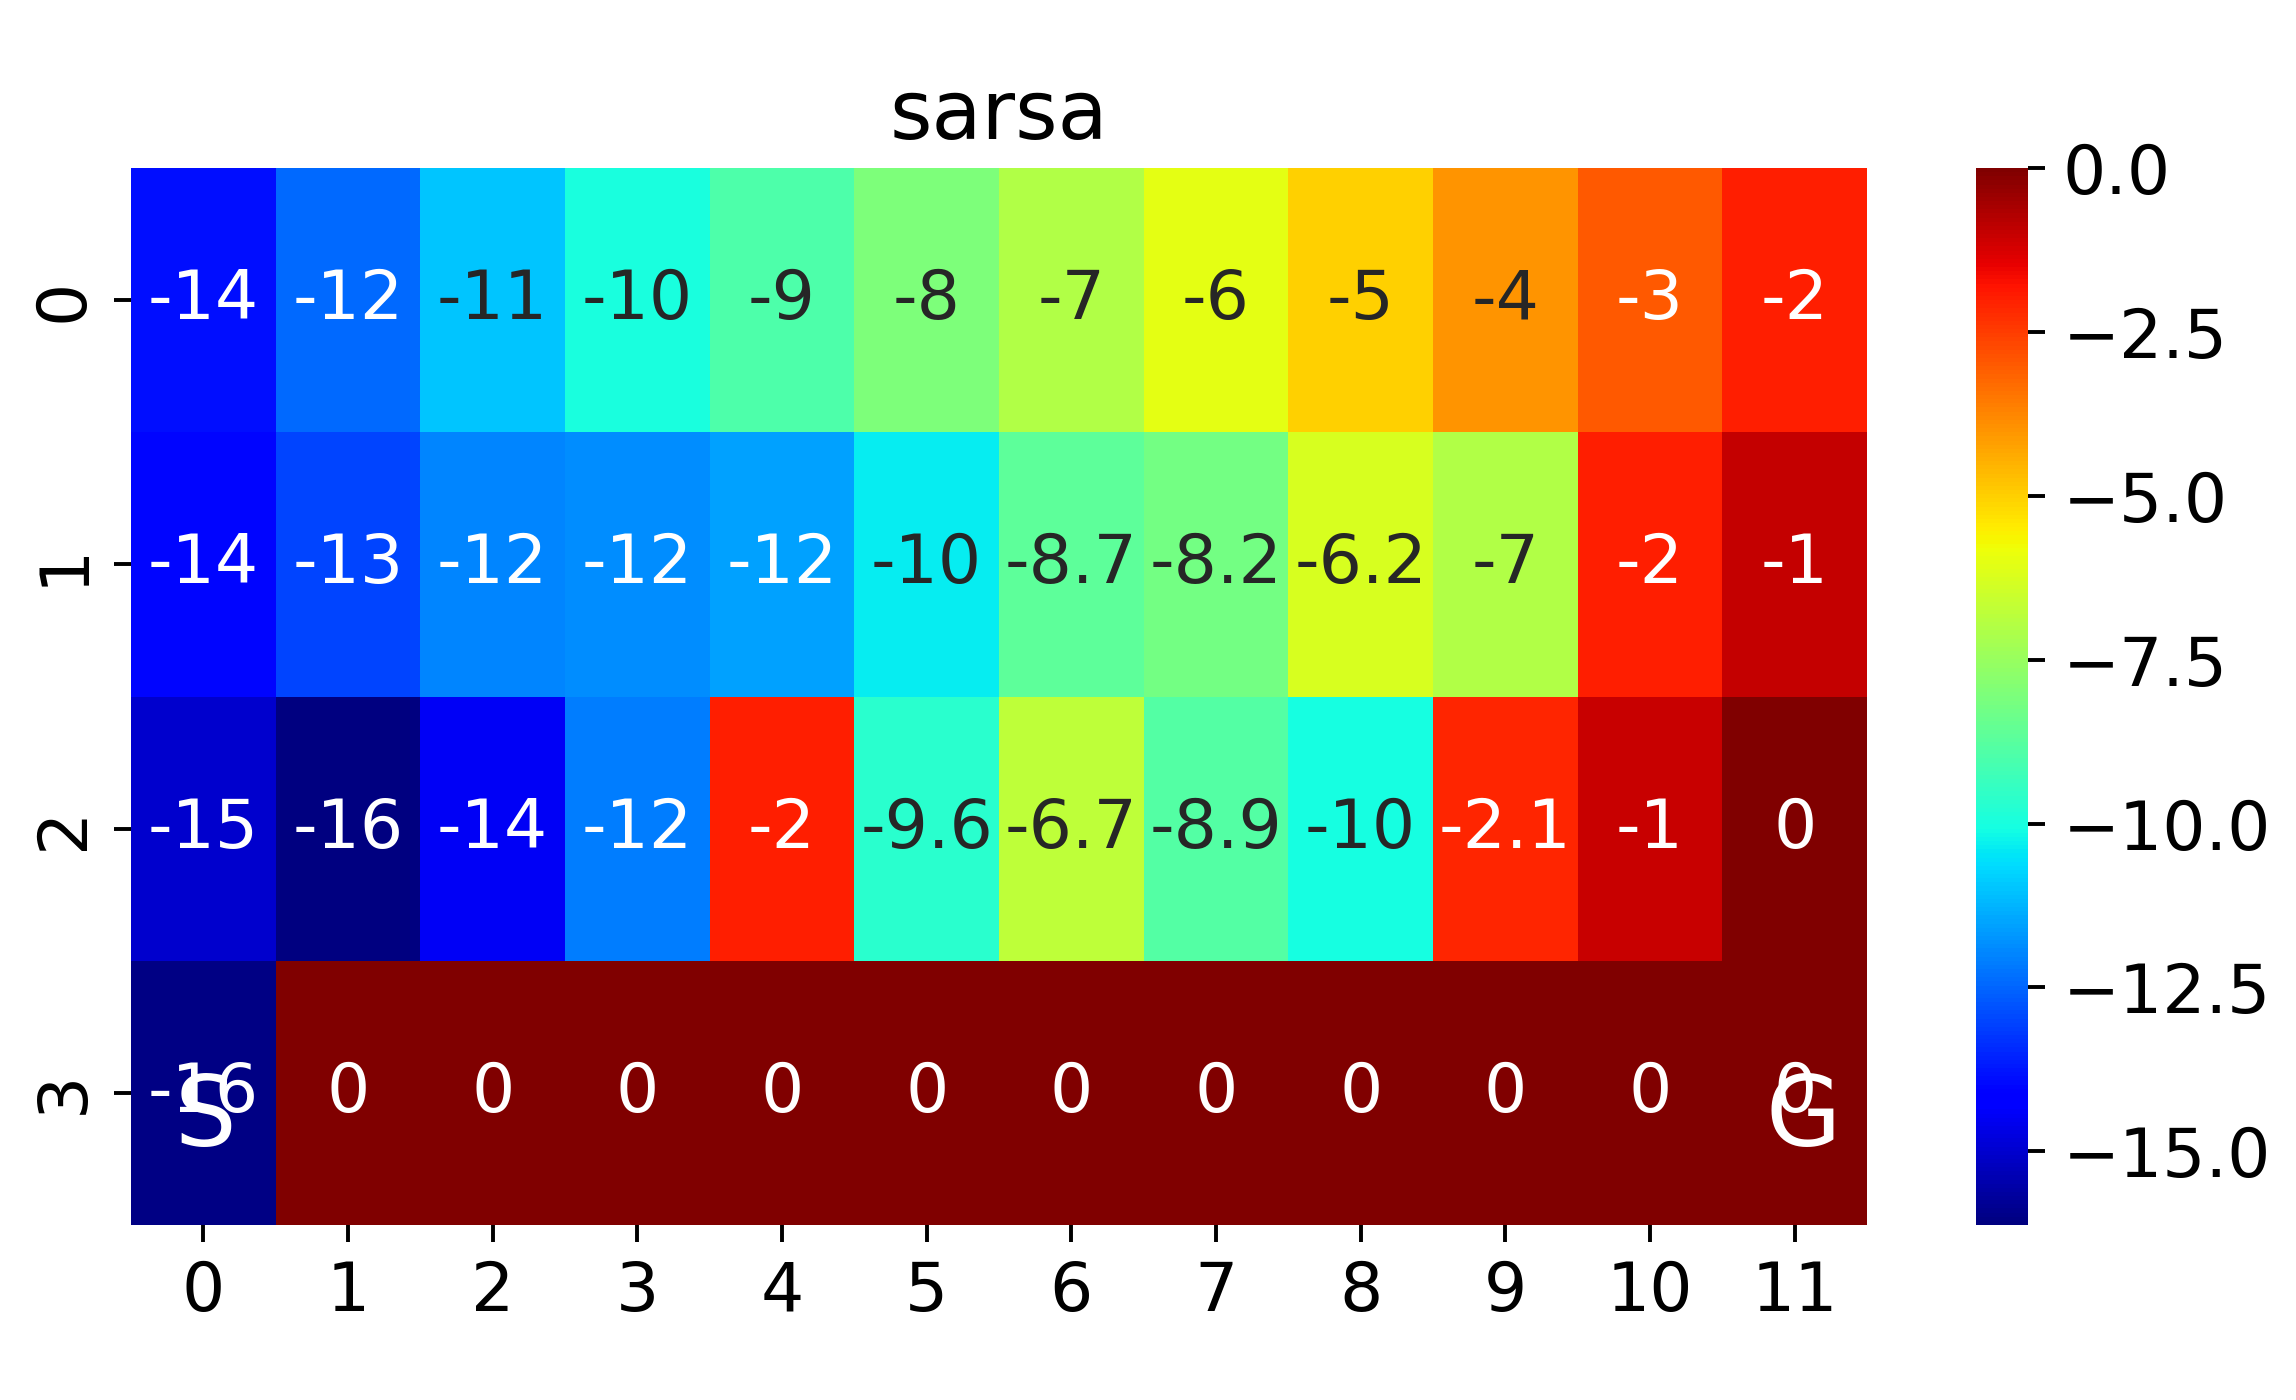
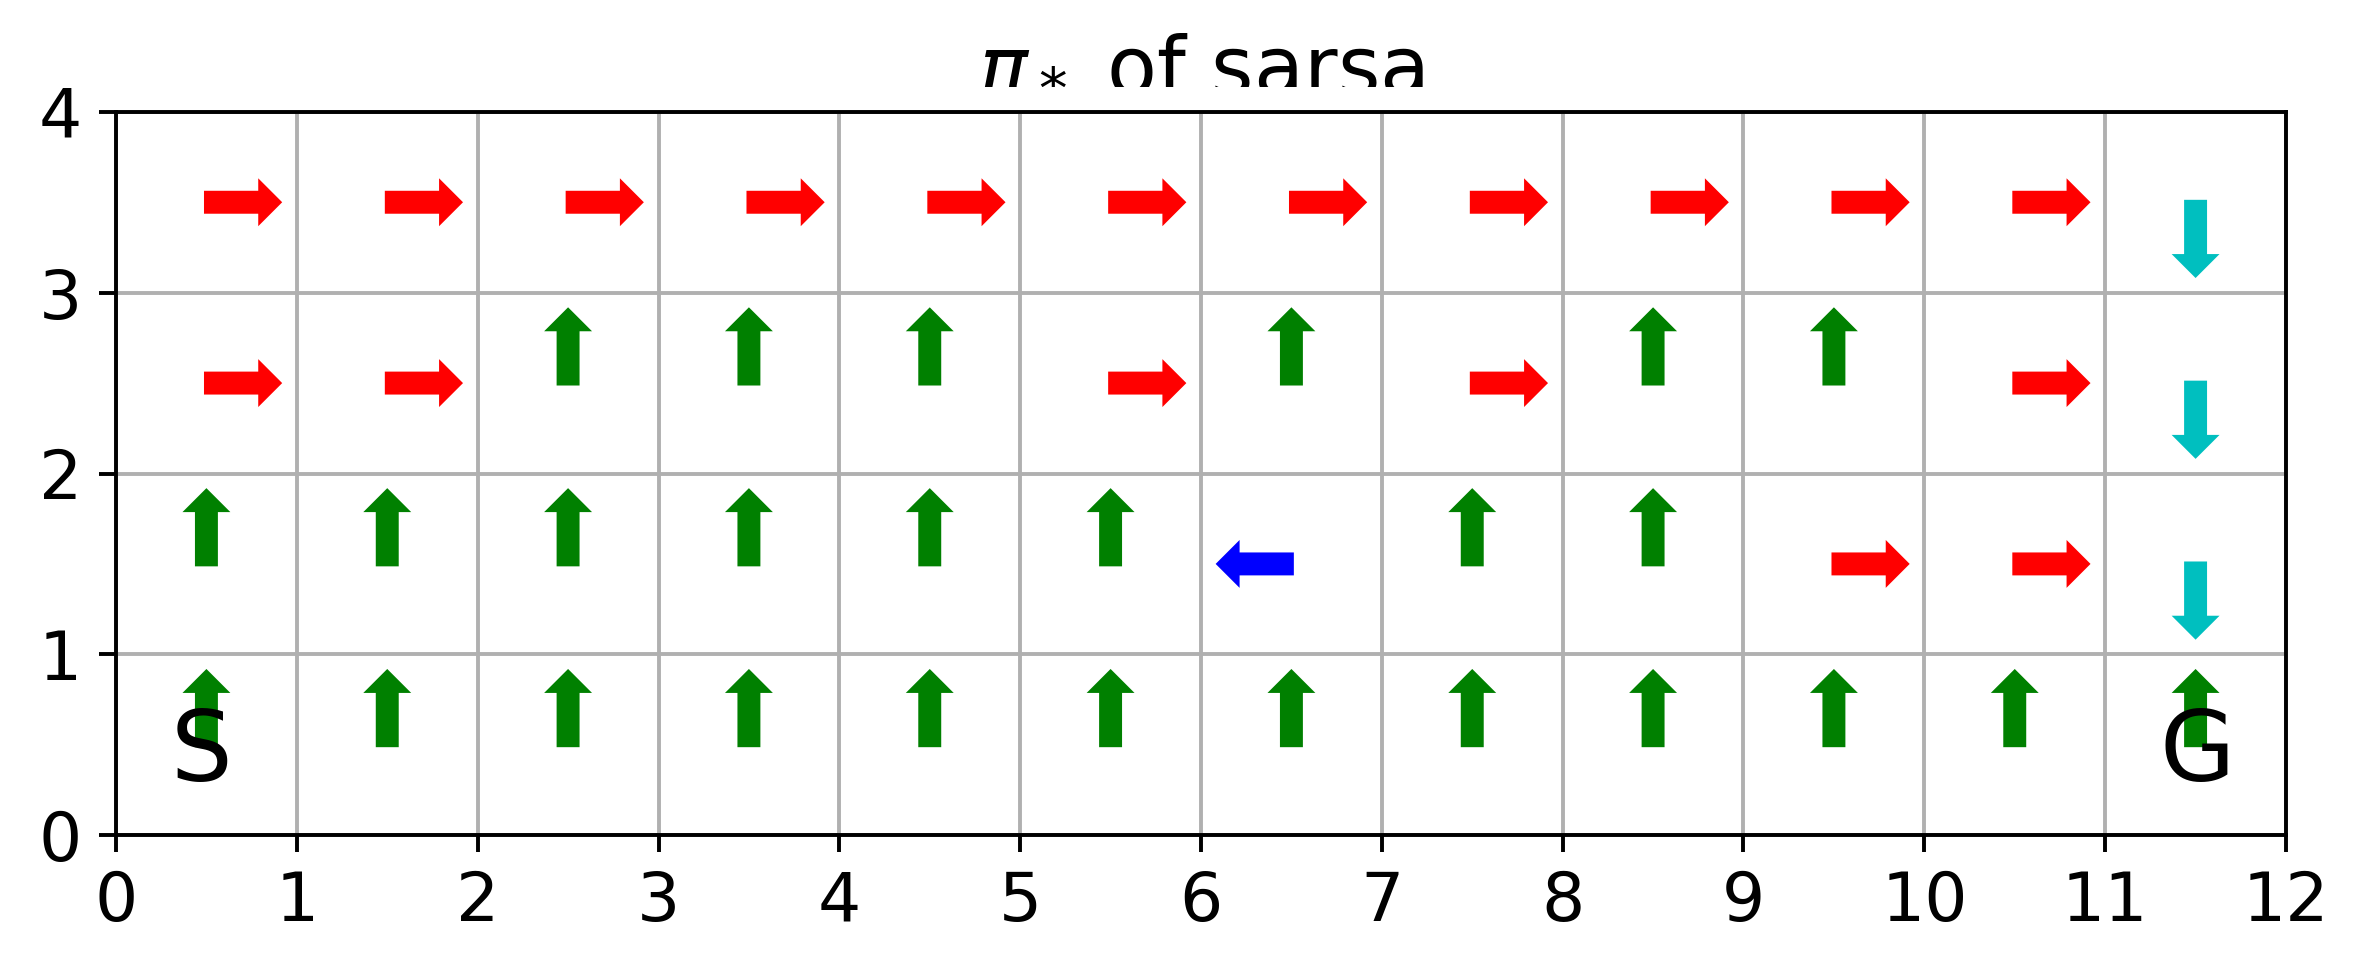
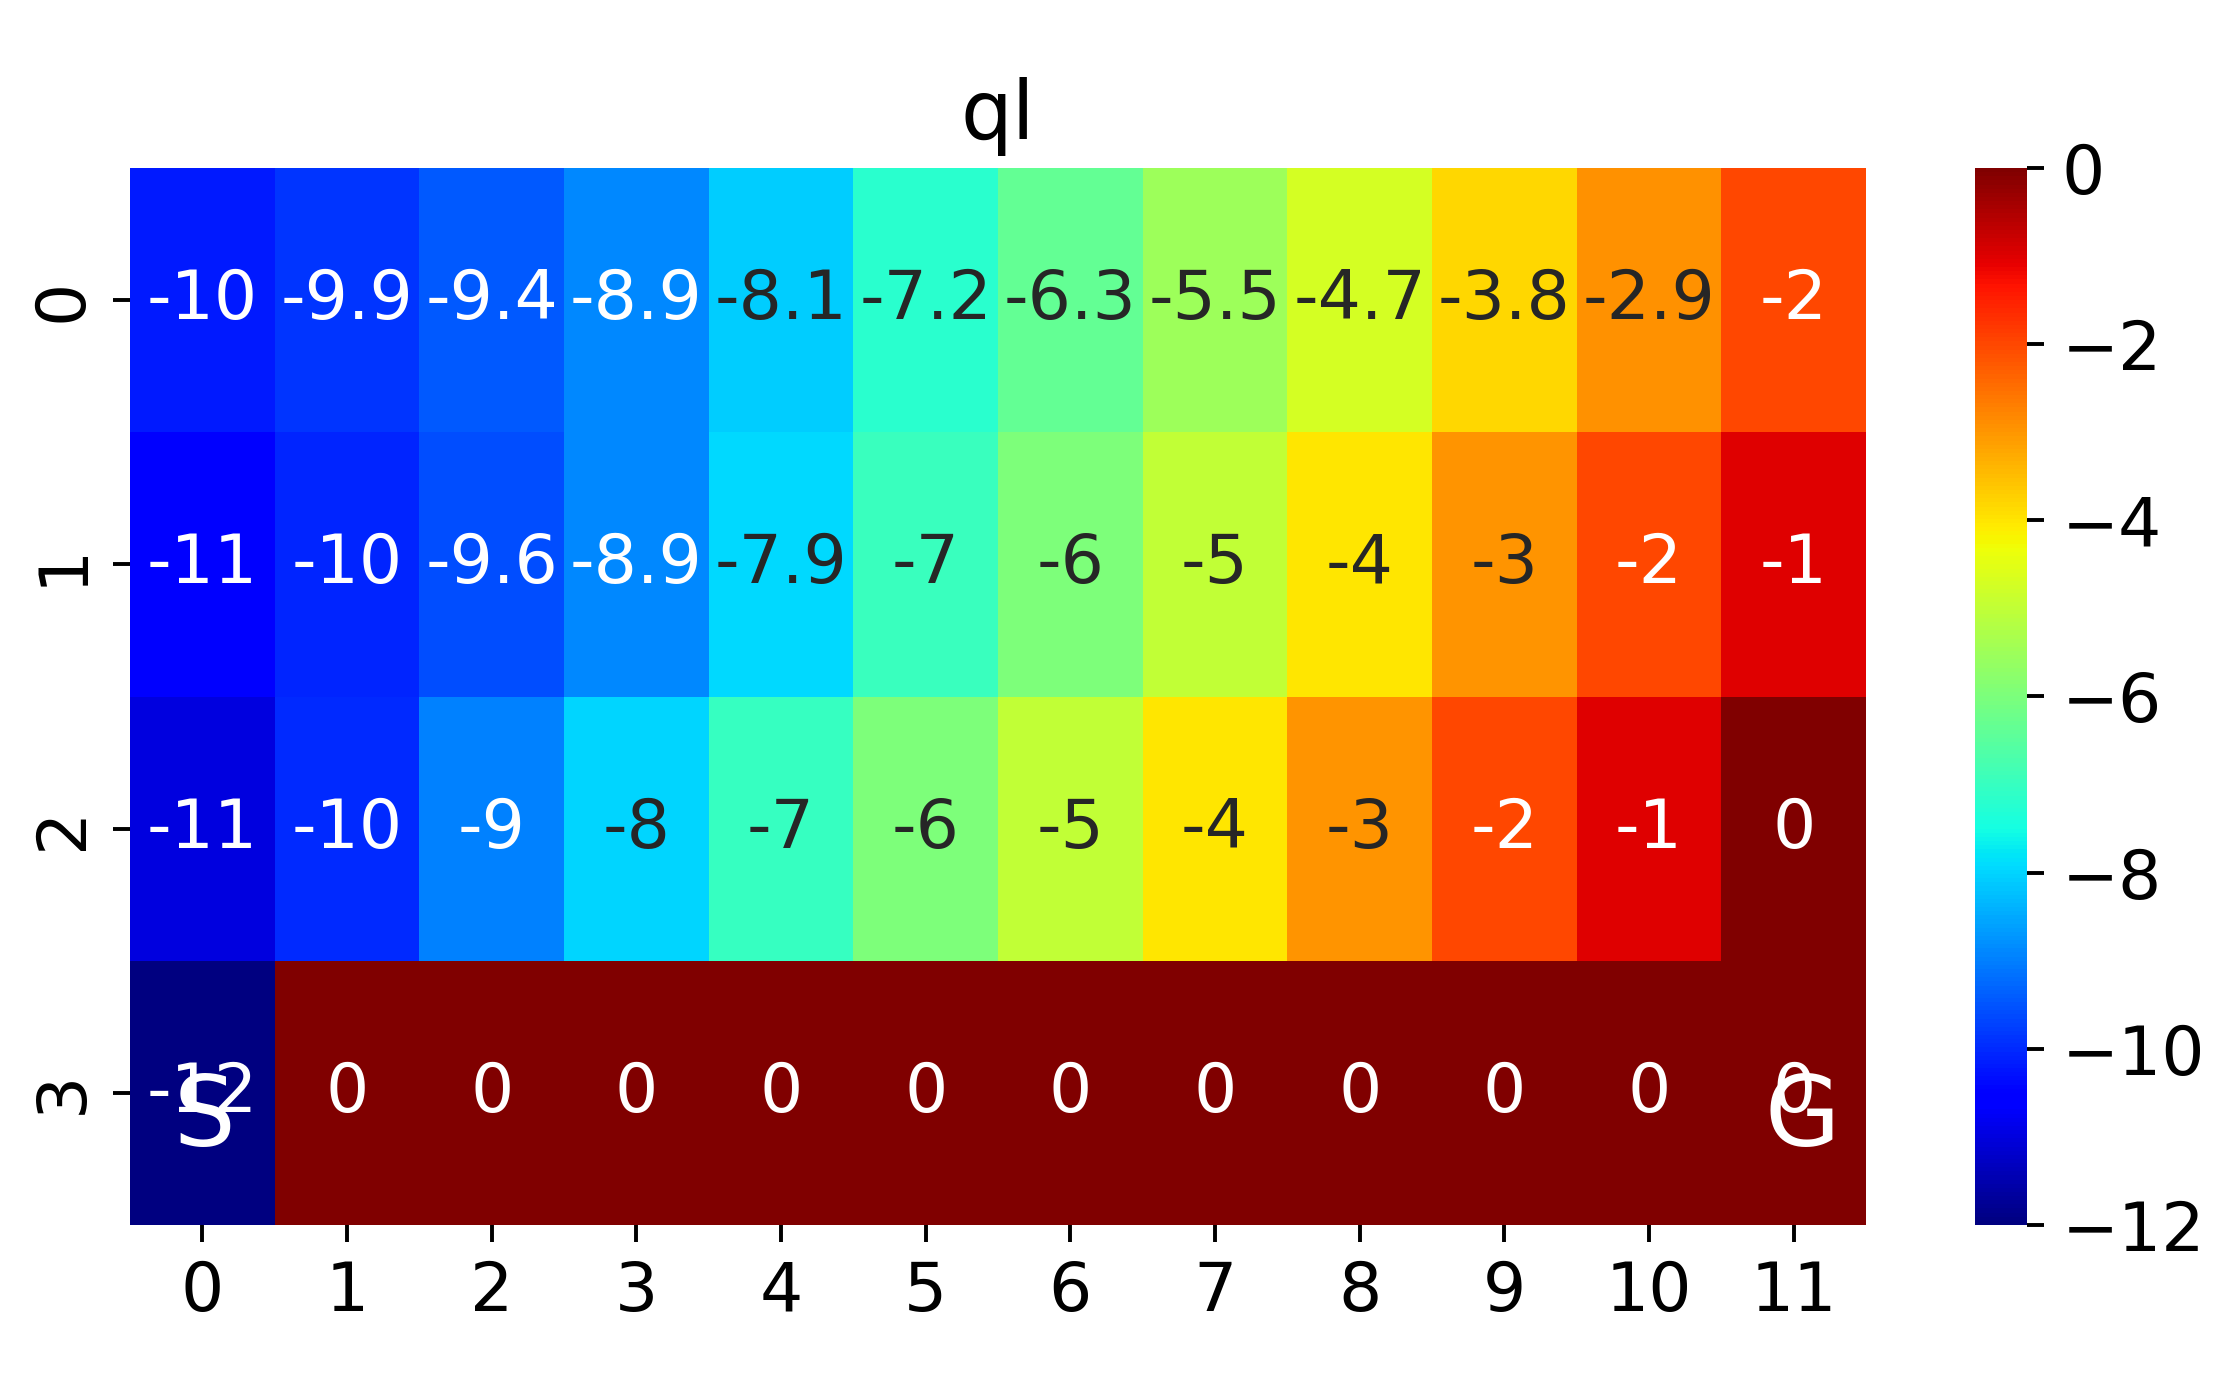
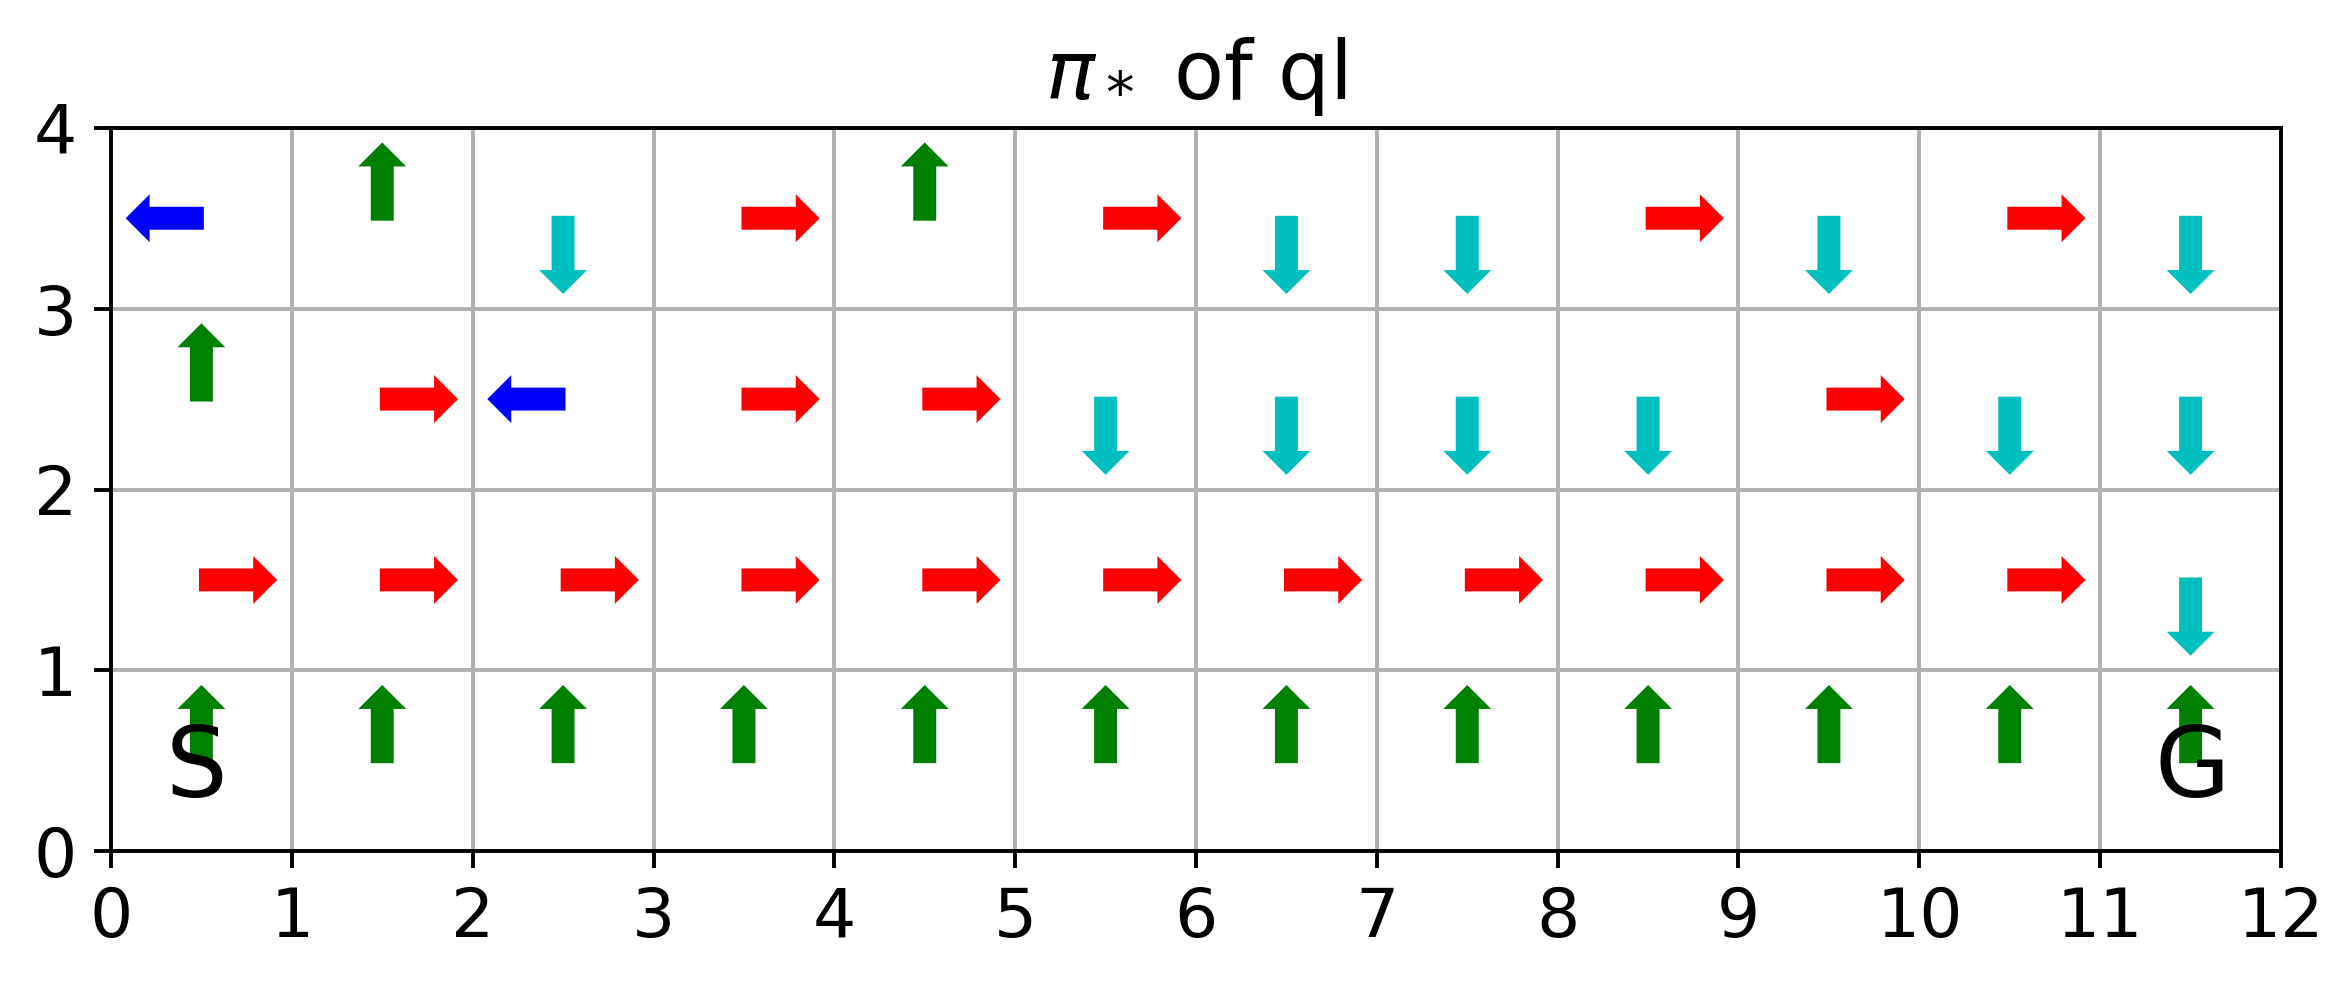
where SARSA converges to a roundabout policy, and Q-learning converges to an optimal one travelling right along the edge of the cliff
If we replace \(\epsilon\)-greedy for SARSA and Q-learning with pure greedy policy, SARSA and Q-learning are the same
Asymptotic and interim performances:
def get_performance(n_runs=10,n_eps=1000):
    lrs=np.arange(0.1,1.1,0.1)
    performance=np.zeros((len(lrs),3))

    for n in range(n_runs):
        for i,lr in enumerate(lrs):
            _,r_sarsa,_,_=run_sarsa(n_eps=n_eps,eps=.1,lr=lr,gm=1.)
            _,r_exp_sarsa,_,_=run_sarsa(expected=True,n_eps=n_eps,eps=.1,lr=lr,gm=1.)
            _,r_q,_,_=run_q(n_eps=n_eps,eps=.1,lr=lr,gm=1.)

            performance[i][0]+=sum(r_sarsa)
            performance[i][1]+=sum(r_exp_sarsa)
            performance[i][2]+=sum(r_q)

    return performance

asy_performance=get_performance(n_runs=1,n_eps=10000)
int_performance=get_performance(n_runs=50,n_eps=100)

labels=['asy_sarsa','asy_expected_sarsa','asy_ql',
        'int_sarsa','int_expected_sarsa','int_ql']

plt.figure(figsize=(8,6))
for i in range(3):
    plt.plot((asy_performance/(10*1000))[:,i],'-o',label=labels[i],linewidth=2)

for i in range(3):
    plt.plot((int_performance/(100*50))[:,i],'-o',label=labels[i+3],linewidth=2)

plt.legend(bbox_to_anchor=(1.04,1), borderaxespad=0)
plt.grid()
plt.xticks(np.arange(10),(np.round(np.arange(0.1,1.1,0.1),1)))
plt.xlabel('Learning rate')
plt.ylabel('Sum of rewards per episode')
plt.savefig('exp_sarsa_cliffwalk.png',dpi=350)
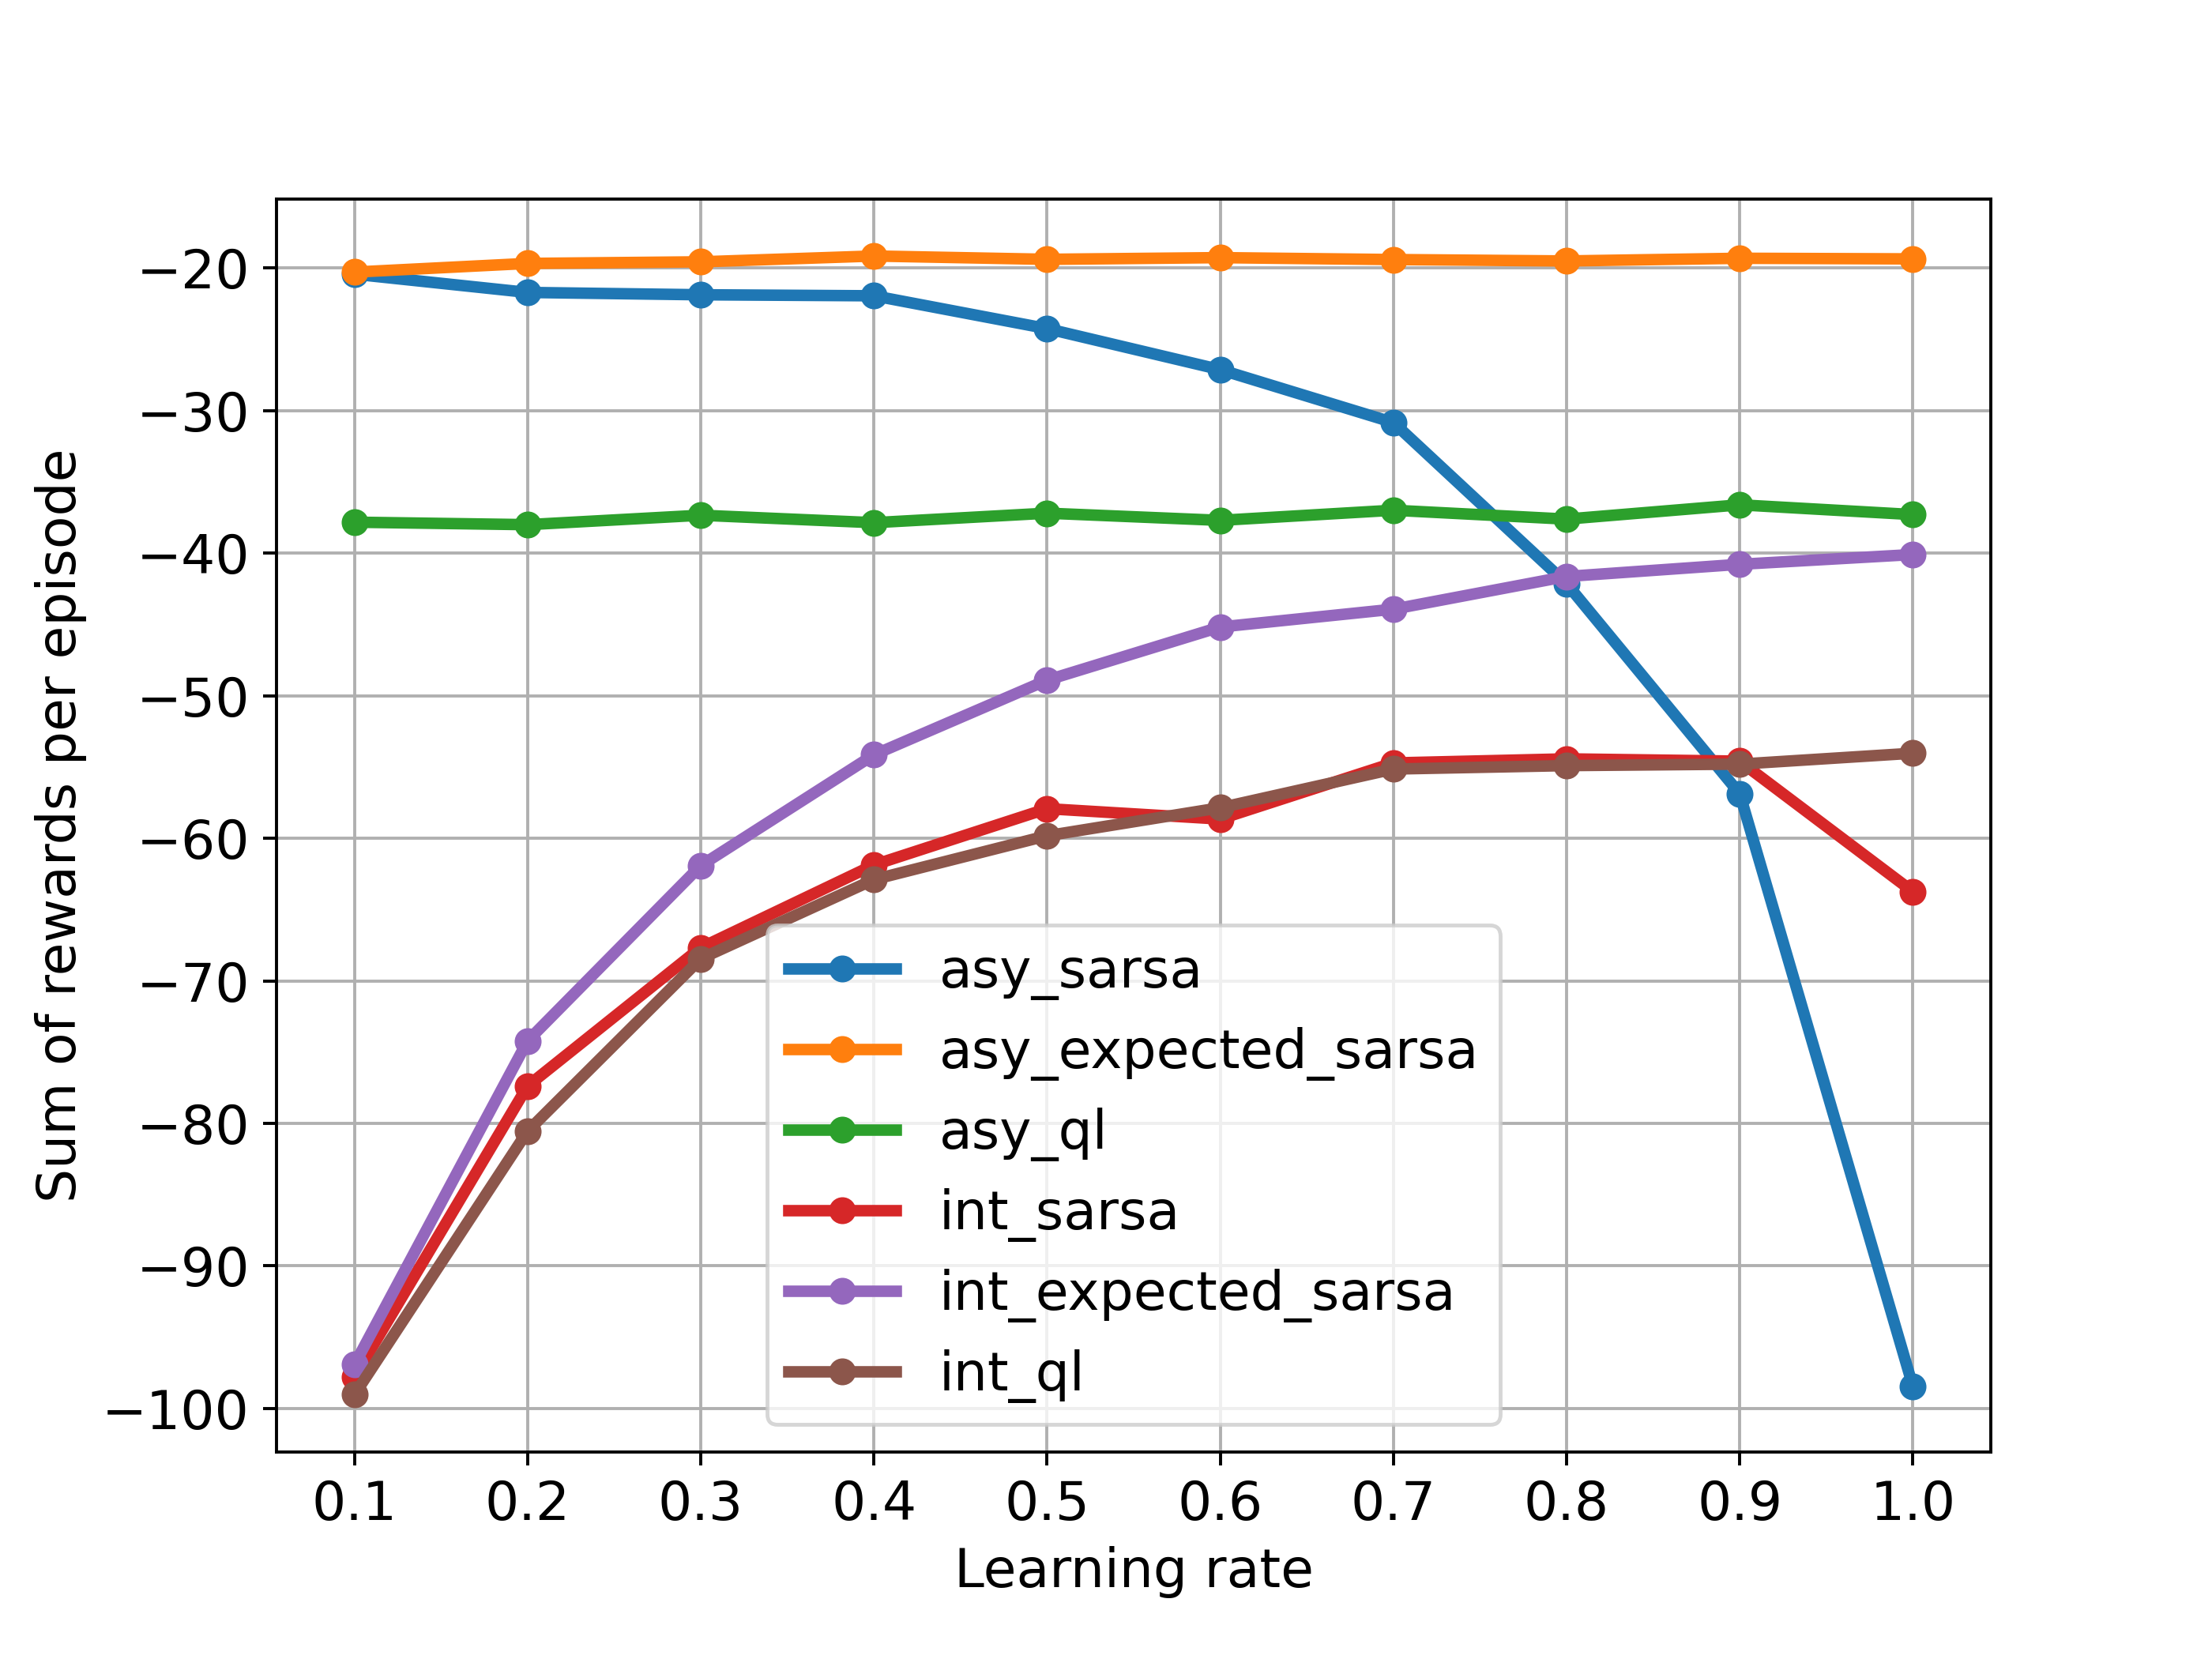
The above corresponds to Figure 6.3: because the state transitions are all deterministic and all randomness comes from the policy, expected SARSA can safely set learning rate at 1 without suffering any degradation of asymptotic performance, whereas SARSA can only perform well in the long run at a small value of learning rate, at which short-term performance is poor
Maximization Bias Example

states: two non-terminal states A,B
actions in state A: {left, right}
actions in state B: like range(0,10)

episodes always start in A
A - right - terminal,r=0
A - left - B - terminal,r=N(-0.1,1)

The expected return for any traj starting with 'left' is -0.1
thus taking 'left' in A is always a mistake

However, Q-learning may favor 'left' because of maximization bias
Implementation of Q-learning and Double Q-learning:
import numpy as np
import matplotlib.pyplot as plt

A_ACTIONS=[0,1] #right,left
B_ACTIONS=range(0,10)
ACTIONS=[A_ACTIONS, B_ACTIONS]

#state A,B,terminal
A,B,T=0,1,2
STATES=[A,B]

START=A

def step(s,a):

    if s==A:
        if a==0: #right
            return T,0,True
        else: #left
            s_=B
            return s_,0,False
    else: #s==B whatever action may lead to Terminal and random Reward
        return T,np.random.normal(-0.1,1),True

def e_greedy(eps,q,s):

    if (np.random.random()<=eps):
        if s==A:
            return np.random.choice(A_ACTIONS)
        else:
            return np.random.choice(B_ACTIONS)
    else:
        return np.random.choice([a for a, qs in enumerate(q[s]) if qs==np.max(q[s])])

def run_q(double=False,n_eps=300,eps=.1,lr=0.1,gm=1.):

    if not double:
        Q=[np.zeros(len(A_ACTIONS)),np.zeros(len(B_ACTIONS)),np.zeros(1)]
    else:
        Q1=[np.zeros(len(A_ACTIONS)),np.zeros(len(B_ACTIONS)),np.zeros(1)]
        Q2=[np.zeros(len(A_ACTIONS)),np.zeros(len(B_ACTIONS)),np.zeros(1)]

    r_all,stp_all,left_all=[],[],[]

    for ep in range(n_eps):

        r_sum,done=0,False
        s=START
        stp_cnt=0
        left_cnt=0

        while not done:

            if not double:
                a=e_greedy(eps,Q,s)
            else:
                a=e_greedy(eps,[q1+q2 for q1,q2 in zip(Q1,Q2)],s)

            if s==A:
                stp_cnt+=1
                if a==1:
                    left_cnt+=1

            s_,r,done=step(s,a)

            if not double:
                delta=r+gm*np.max(Q[s_])-Q[s][a]
                Q[s][a]+=lr*delta
            else:
                if np.random.choice([0,1])==1:
                    a_max=np.random.choice([a for a, q in enumerate(Q1[s_]) if q==np.max(Q1[s_])])
                    delta=r+gm*Q2[s_][a_max]-Q1[s][a]
                    Q1[s][a]+=lr*delta
                else:
                    a_max=np.random.choice([a for a, q in enumerate(Q2[s_]) if q==np.max(Q2[s_])])
                    delta=r+gm*Q1[s_][a_max]-Q2[s][a]
                    Q2[s][a]+=lr*delta

            s=s_
            r_sum+=r

        r_all.append(r_sum)
        stp_all.append(stp_cnt)
        left_all.append(left_cnt)

        #if ep%10==0:
        #    print(f'ep:{ep}, stps:{stp}, ret:{r_sum}')
    if not double:
        return Q,r_all,left_all,stp_all
    else:
        return Q1,Q2,r_all,left_all,stp_all

n_runs=1000

left_all=[]
stp_all=[]
for n in range(n_runs):
    Q,r_q,left,stp=run_q()
    left_all.append(left)
    stp_all.append(stp)

plt.figure(figsize=(8,6))
plt.rcParams['font.size']='14'
plt.plot((np.array(left_all)/np.array(stp_all)).mean(axis=0),label='Q-learning',linewidth=2)

left_all=[]
stp_all=[]
for n in range(n_runs):
    Q1,Q2,r_dq,left,stp=run_q(double=True)
    left_all.append(left)
    stp_all.append(stp)

plt.plot((np.array(left_all)/np.array(stp_all)).mean(axis=0),label='Double Q-learning',linewidth=2)
plt.axhline(0.05,color='g',linestyle='--',label='optimal',linewidth=2)
plt.legend()
plt.grid()
plt.xlabel('Episodes')
plt.ylabel('% left actions from state A')
plt.savefig('doubleq_maxbias.png',dpi=350)
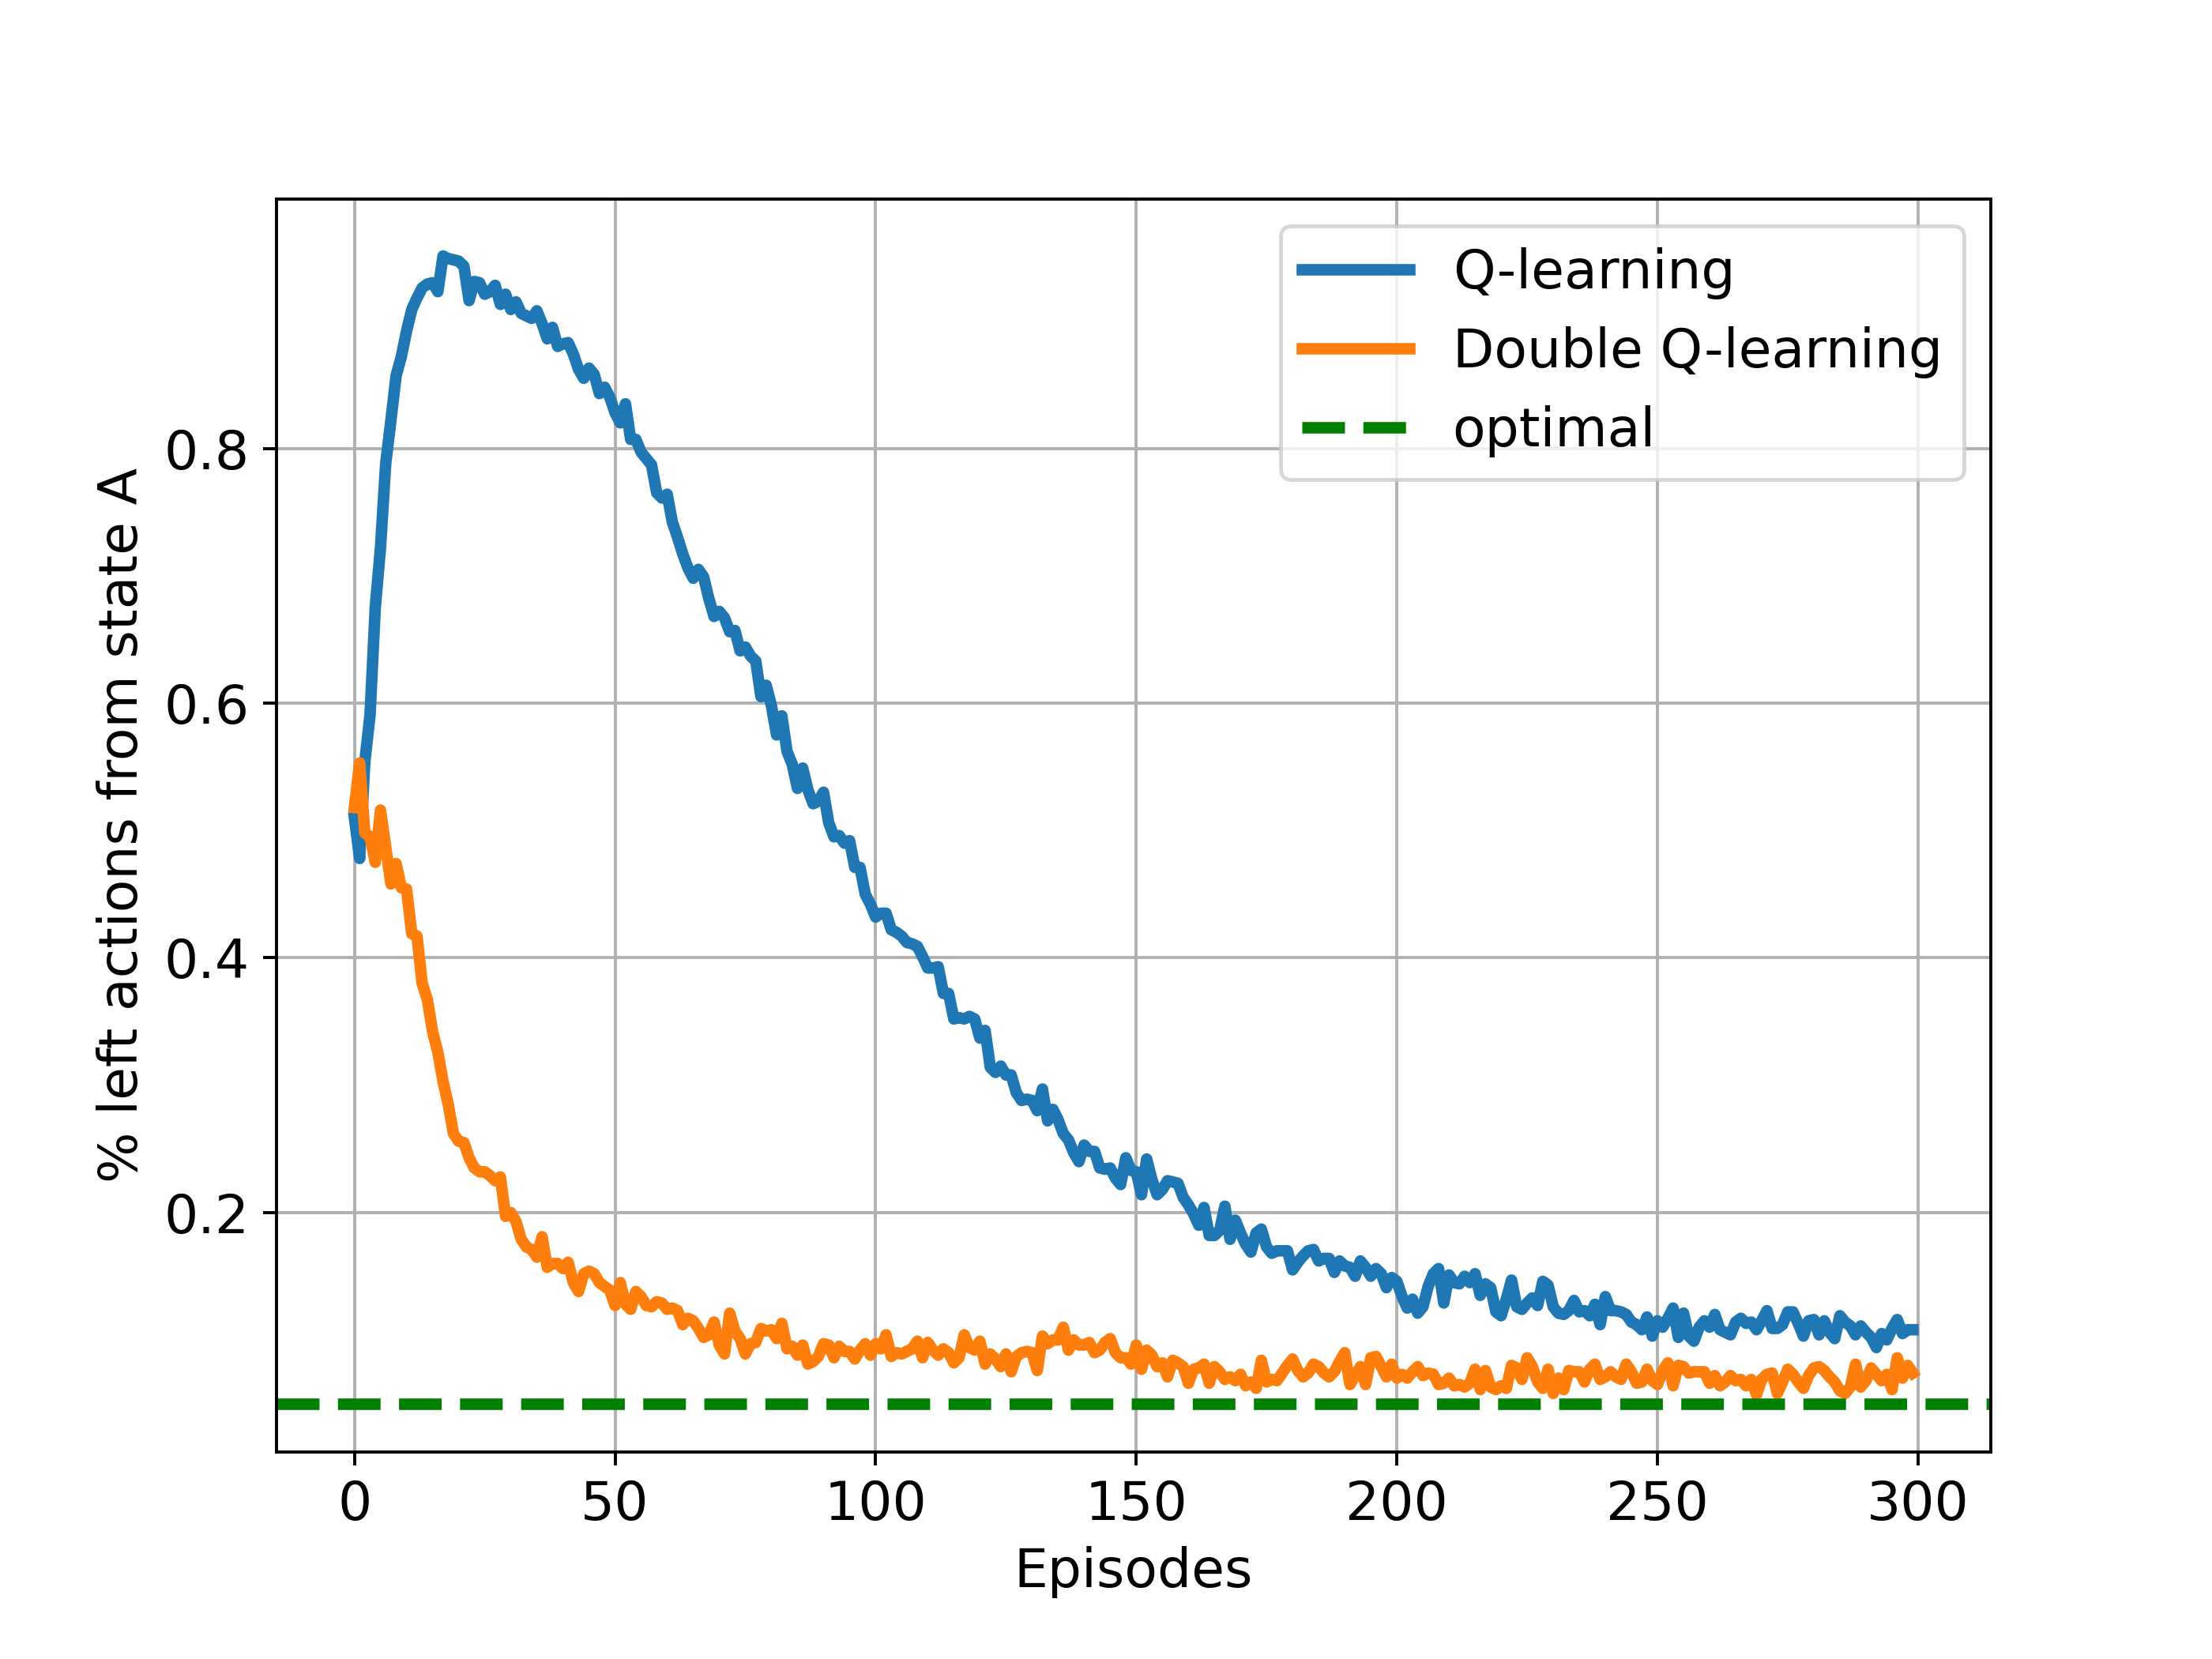
The above corresponds to Figure 6.5
References
Reinforcement Learning an Introduction 2nd edition, Chapter 6 by Sutton and Barto
ShangtongZhang/reinforcement-learning-an-introduction
RL 2nd Edition Excercise Solutions
Deep Reinforcement Learning - Julien Vitay