Gibbs Sampling
Definition
In statistics, Gibbs sampling or a Gibbs sampler is a Markov chain Monte Carlo (MCMC) algorithm for obtaining a sequence of observations which are approximately from a specified multivariate probability distribution, when direct sampling is difficult.
This sequence can be used
- to approximate the joint distribution (i.e. to generate a histogram of the distribution)
- to approximate the marginal distribution of one of the variables, or some subset of the variables (i.e. the unknown parameters or latent variables)
- to compute an integral (i.e. the expected value of one of the variables)
Typically, some of the variables correspond to observations whose values are known, and hence do not need to be sampled.
Gibbs Sampling is:
- commonly used as a means of statistical inference, especially Bayesian inference
- a randomized algorithm (i.e. an algorithm that makes use of random numbers)
- an alternative to deterministic algorithms for statistical inference (i.e. EM algorithm)
Line Fitting
Model
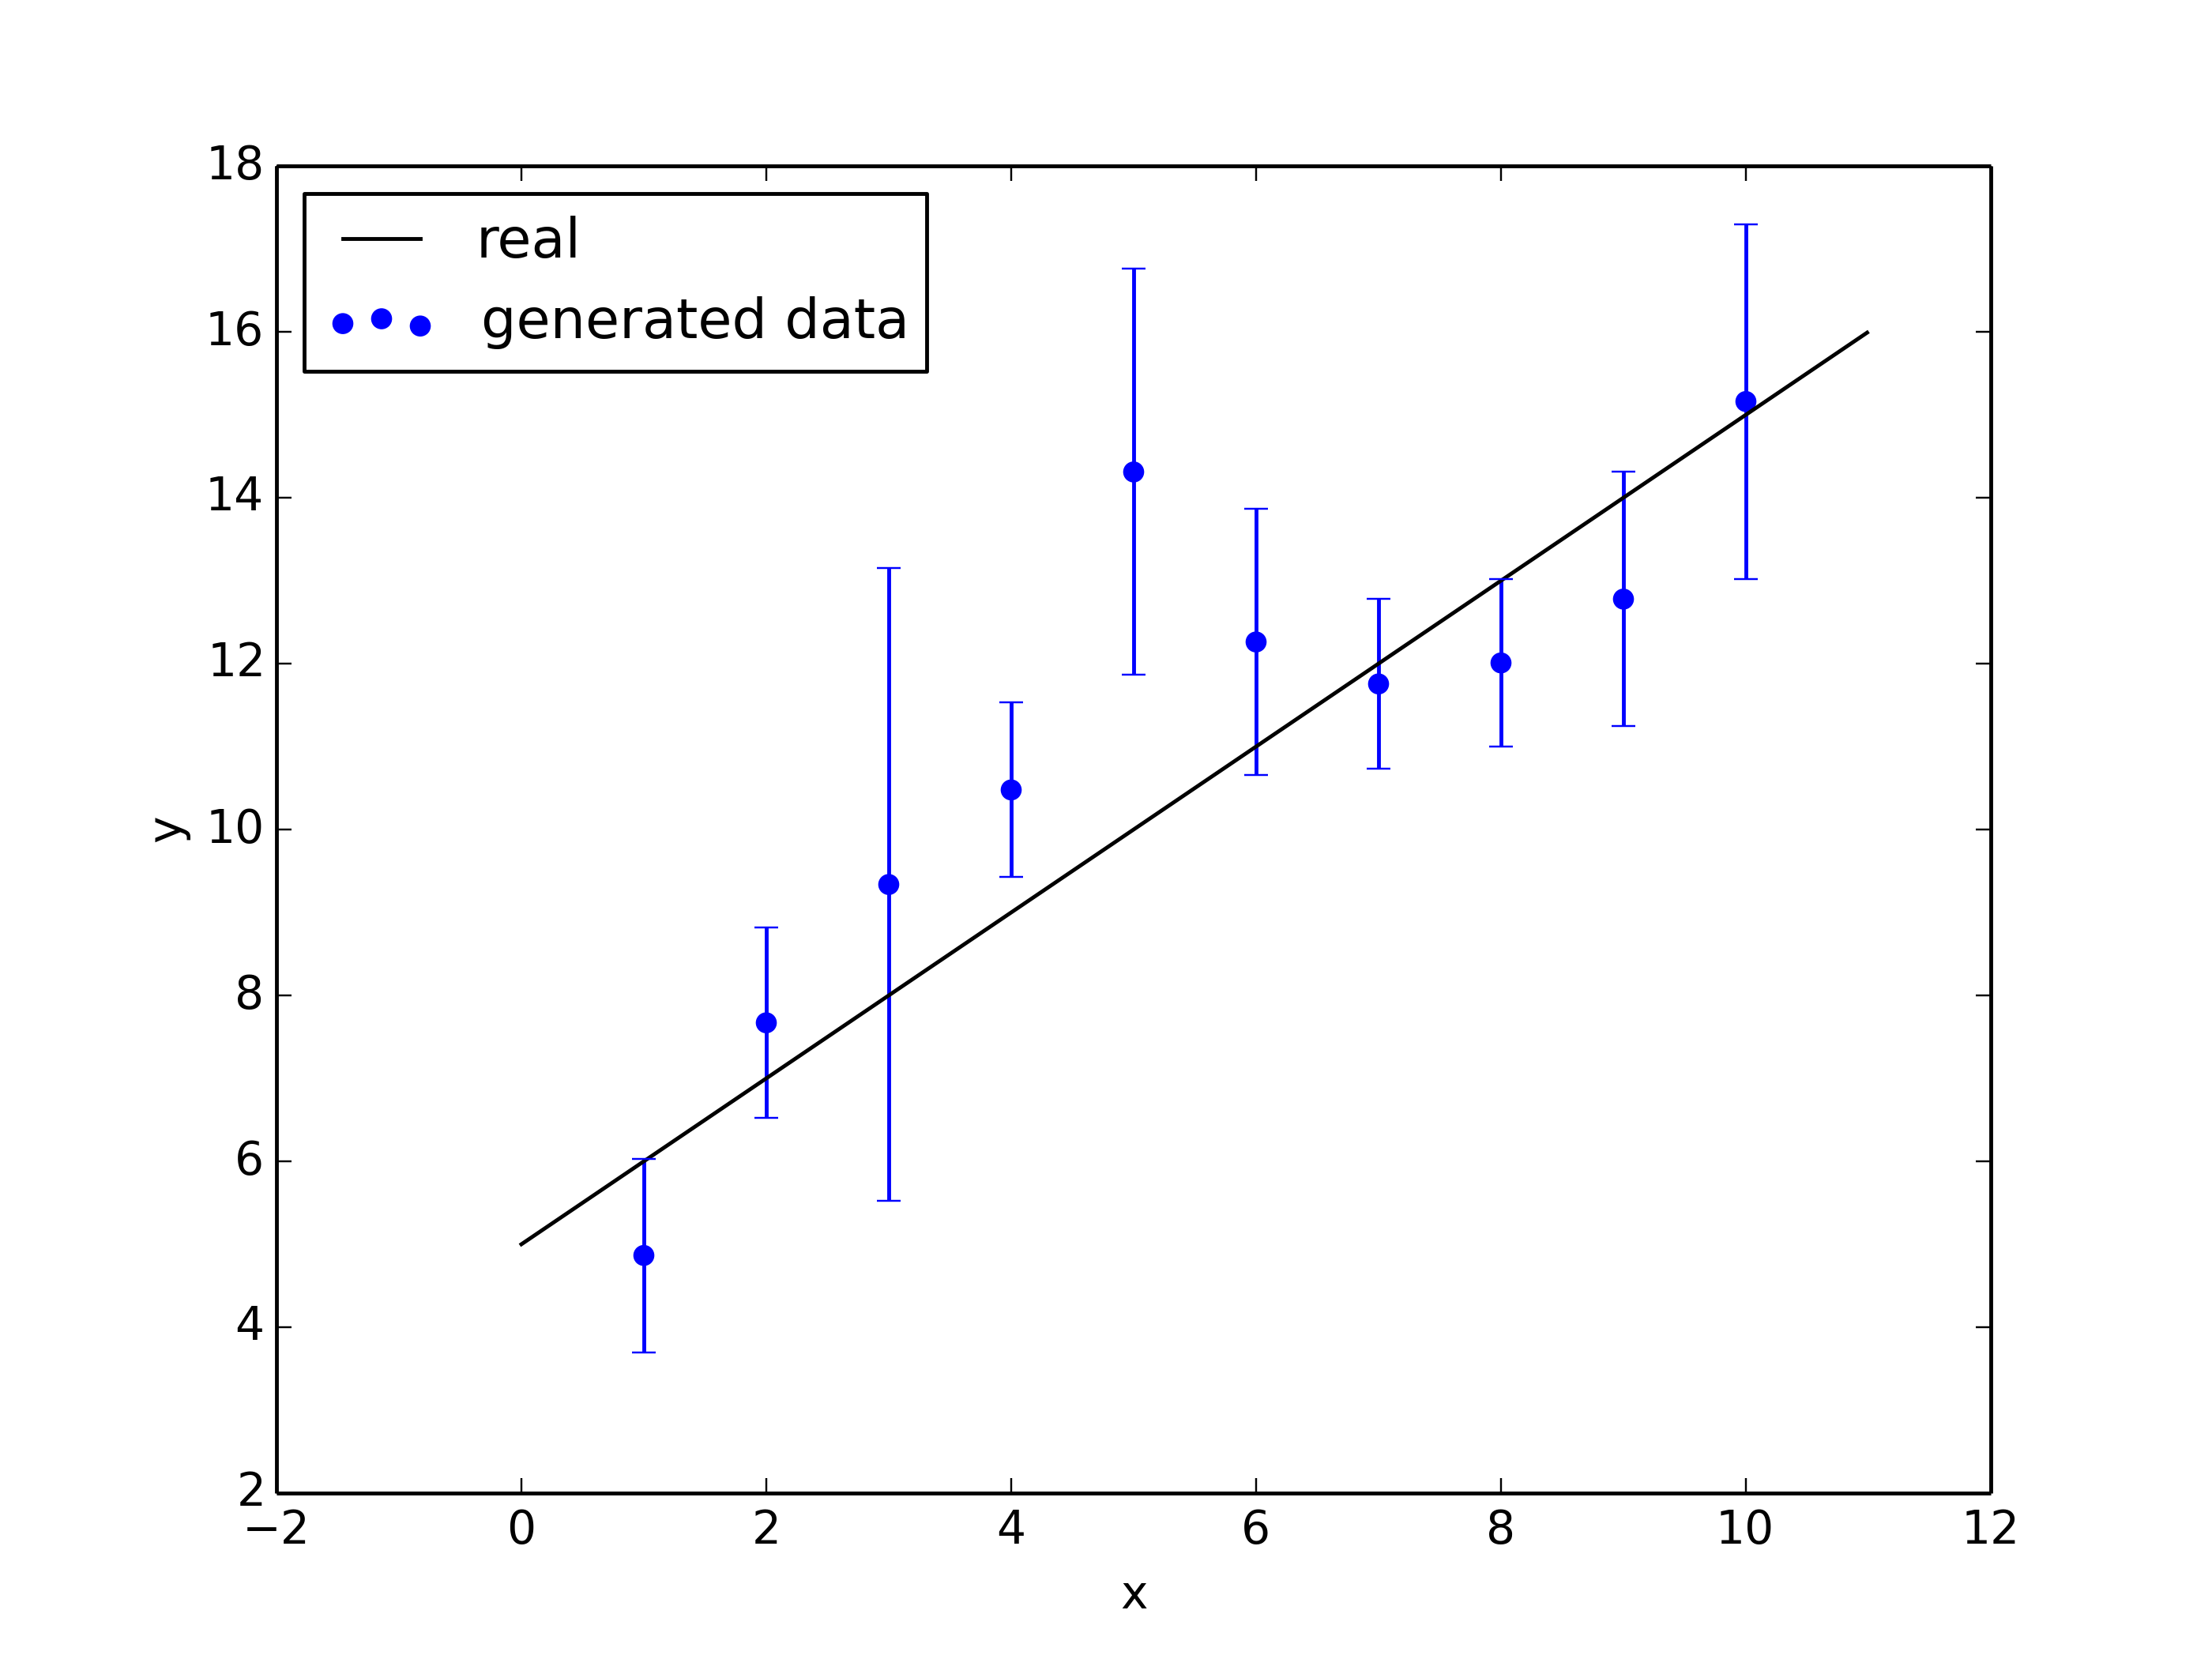
Given: data {x_i}=X, {y_i}=Y and uncertainties {σ_i} (underlying model y=ax+b+σ)
Goal: find parameters a,b using Gibbs sampling
Define the posterior distribution of our model parameters a,b:
            p(Y|a,b)p(a,b)
p(a,b|Y) = ----------------
                 p(Y)

p(Y) can be dropped since it's fixed

p(a,b|Y) ∝ p(Y|a,b)p(a,b)
The uncertainties are Gaussian so the likelihood p(Y|a,b):
                  1              (y_i-ax_i-b)^2
p(Y|a,b) = ∏ ------------- exp(- ---------------)
           i sqrt(2πσ_i^2)           2σ_i^2
Assume a prior for a,b:
p(a,b) ∝ 1
Now the posterior:
                    (y_i-ax_i-b)^2
p(a,b|Y) ∝ exp(- Σ ---------------)
                       2σ_i^2
Gibbs Sampling relies on sampling from the conditional distribution for each parameter in turn, like:
p(a|b,Y), p(b|a,Y)
(+) can be useful when it is very difficult or impossible to sample from the joint distribution of all model parameters
(+) is only useful if the conditional distribution in a form which is easy to directly sample from without rejection, i.e. Gaussian
The conditional distribution by treating all other model parameters as fixed:
                   y_i^2+a^2x_i^2+b^2-2ax_iy_i-2y_ib+2abx_i             a^2x_i^2-2ax_iy_i+2abx_i
p(a|b,Y) ∝ exp(- Σ -----------------------------------------) ∝ exp(- Σ ------------------------)
                 i                   2σ_i^2                           i         2σ_i^2
Note: only take a, and omit other parameters like b and other variables like y_i,x_i
Turn the proportional result of p(a|b,Y) into Gaussian form:
                        x_i^2
p(a|b,Y) ∝ exp(- 1/2 Σ (-----) (a-μ_a)^2)
                     i  σ_i^2
This is a Gaussian with mean and std:
         x_iy_i          x_i
      Σ (------) - b Σ (------)
      i   σ_i^2      i   σ_i^2
μ_a = --------------------------
               x_i^2
            Σ (------)
            i  σ_i^2

          x_i^2
σ_a = [Σ (------)]^(-1/2)
       i  σ_i^2
Similarly, p(b|a,Y)’s mean and std:
           y_i           x_i
      Σ (------) - a Σ (------)
      i   σ_i^2      i   σ_i^2
μ_b = --------------------------
                   1
              Σ (------)
              i  σ_i^2

            1
σ_b = [Σ (------)]^(-1/2)
       i  σ_i^2
Implementation
import numpy as np

a=1
b=5

x_vals = np.arange(1,11) #1~10
y_vals = a*x_vals + b

y_errs = 1.+np.random.randn(10)**2 # sigma, known
y_vals = y_vals + y_errs*np.random.randn(10)

x = np.arange(0, 11, 0.01)

plt.figure()
plt.plot(x, a*x + b, color="black",label='real')
plt.errorbar(x_vals, y_vals, y_errs, capsize=3, color="blue",ls="")
plt.scatter(x_vals, y_vals, color="blue",label='generated data')
plt.xlabel('x')
plt.ylabel('y')
plt.legend()
plt.savefig('gibbs_data.png',dpi=350)
plt.clf()

#theta=[a,b]

def sample_a(theta):

    b=theta[1]
    mu_a_no = np.sum(y_vals*x_vals/y_errs**2) - b*np.sum(x_vals/y_errs**2)
    mu_a_de = np.sum(x_vals**2/y_errs**2)

    mu_a = mu_a_no / mu_a_de
    sig_a = 1./np.sqrt(mu_a_de)

    return sig_a*np.random.randn()+mu_a

def smaple_b(theta):

    a=theta[0]
    mu_b_no = np.sum(y_vals/y_errs**2) - a*np.sum(x_vals/y_errs**2)
    mu_b_de = np.sum(1./y_errs**2)

    mu_b = mu_b_no / mu_b_de
    sig_b = 1./np.sqrt(mu_b_de)

    return sig_b*np.random.randn()+mu_b

#start sampling

n_samples=11000
theta=np.zeros(2)

a_samples = np.zeros(n_samples)
b_samples = np.zeros(n_samples)

for i in range(1,n_samples):
    #generate [0,1] [1,0] in random order
    order=np.random.choice(np.arange(2),2,replace=False)  #randomized the order to increase efficiency

    for j in order:
        if j==0:
            a_samples[i]=sample_a(theta)
            theta[0]=np.copy(a_samples[i])
        else:
            b_samples[i]=sample_b(theta)
            theta[1]=np.copy(b_samples[i])

plt.figure()
plt.scatter(a_samples,b_samples,color='blue',label='samples of a,b')
plt.scatter(a,b,color='red',label='true a,b')
plt.plot(a_samples, b_samples, color="gray", alpha=0.5, lw=0.5)
plt.xlabel('a')
plt.ylabel('b')
plt.legend()
plt.savefig('gibbs_sample.png',dpi=350)

plt.figure()
plt.hist(a_samples[1000:],bins=50,color='blue',edgecolor='blue',label='samples of a dist')
plt.axvline(a,color='red',label='real a')
plt.legend()
plt.savefig('gibbs_a.png',dpi=350)
plt.clf()

plt.figure()
plt.hist(b_samples[1000:],bins=50,color='blue',edgecolor='blue',label='samples of b dist')
plt.axvline(b,color='red',label='real b')
plt.legend()
plt.savefig('gibbs_b.png',dpi=350)
plt.clf()

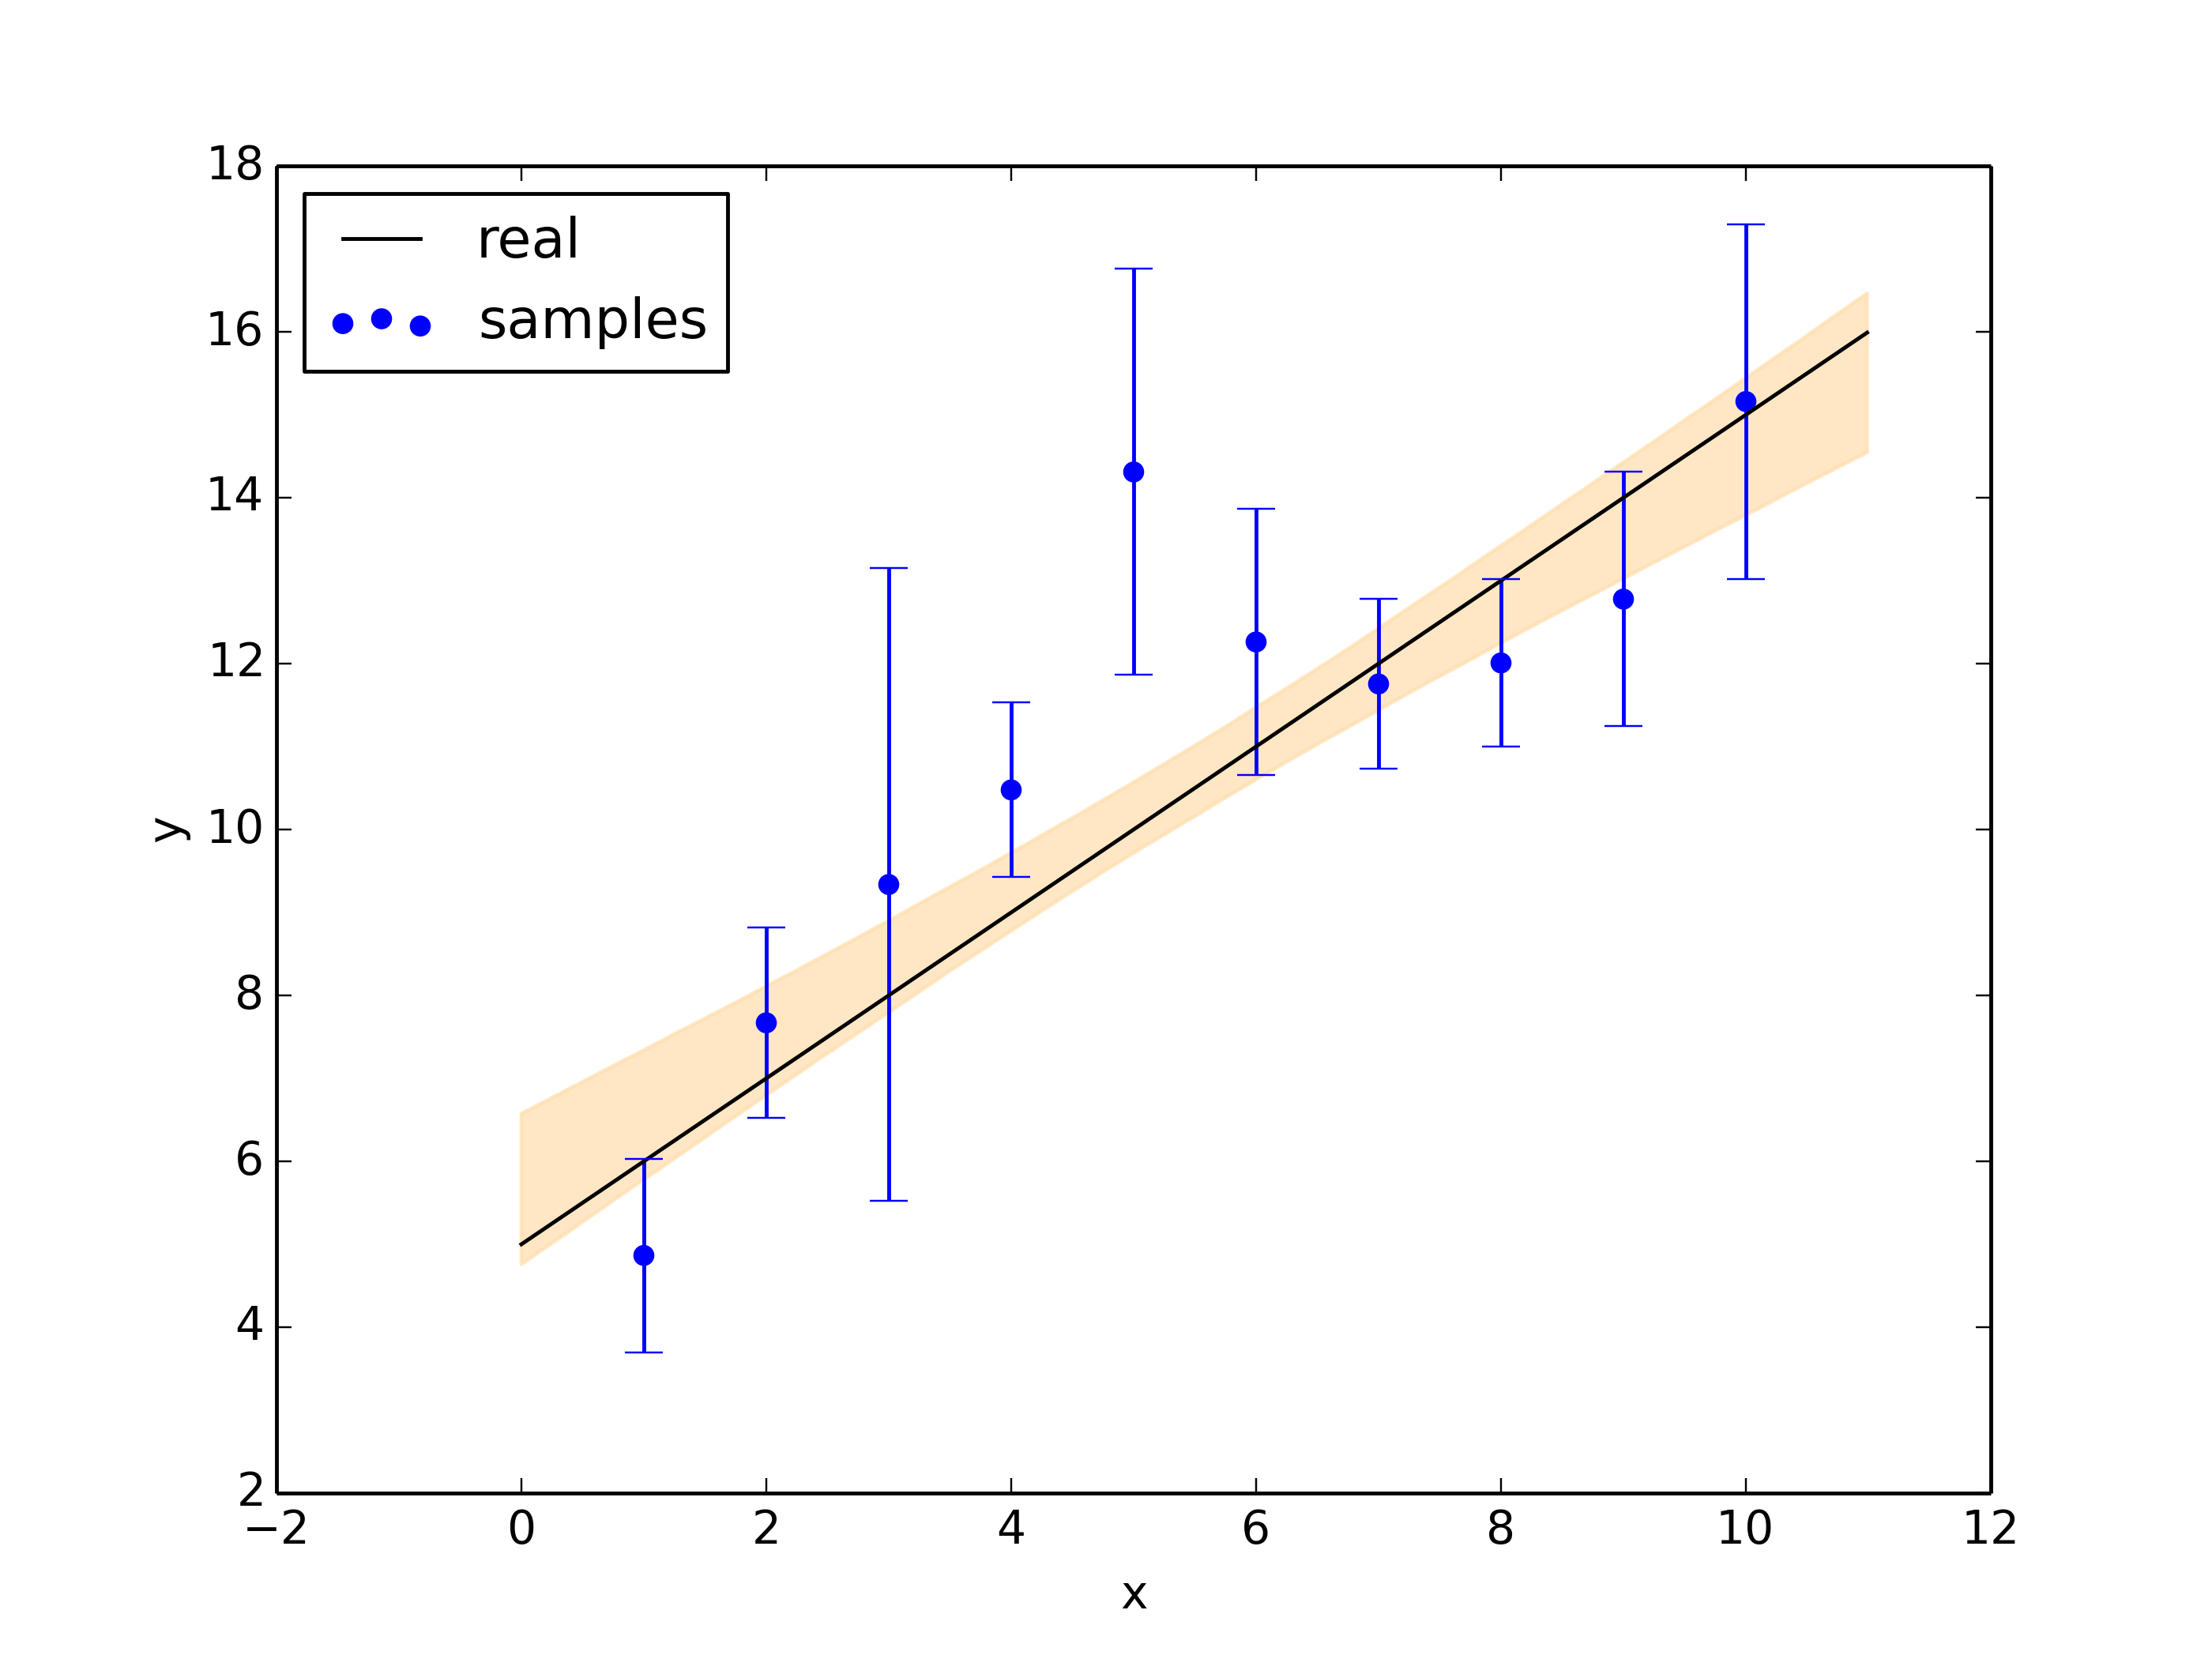
#posterior quantiles from 16%~84%

a_samples_burn=a_samples[1000:]
b_samples_burn=b_samples[1000:]

y_post=np.expand_dims(x,1)*a_samples_burn+b_samples_burn
y_quantiles=np.percentile(y_post,(16, 84), axis=1)

plt.figure()
plt.fill_between(x, y_quantiles[0,:], y_quantiles[1,:], color="navajowhite", alpha=0.7)
plt.plot(x, a*x + b, color="black",label='real')
plt.errorbar(x_vals, y_vals, y_errs, ls="", capsize=3, color="blue")
plt.scatter(x_vals, y_vals, color="blue",label='samples')
plt.legend(loc='upper left')
plt.xlabel('x')
plt.ylabel('y')
plt.savefig('gibbs_post.png',dpi=350)
Results:
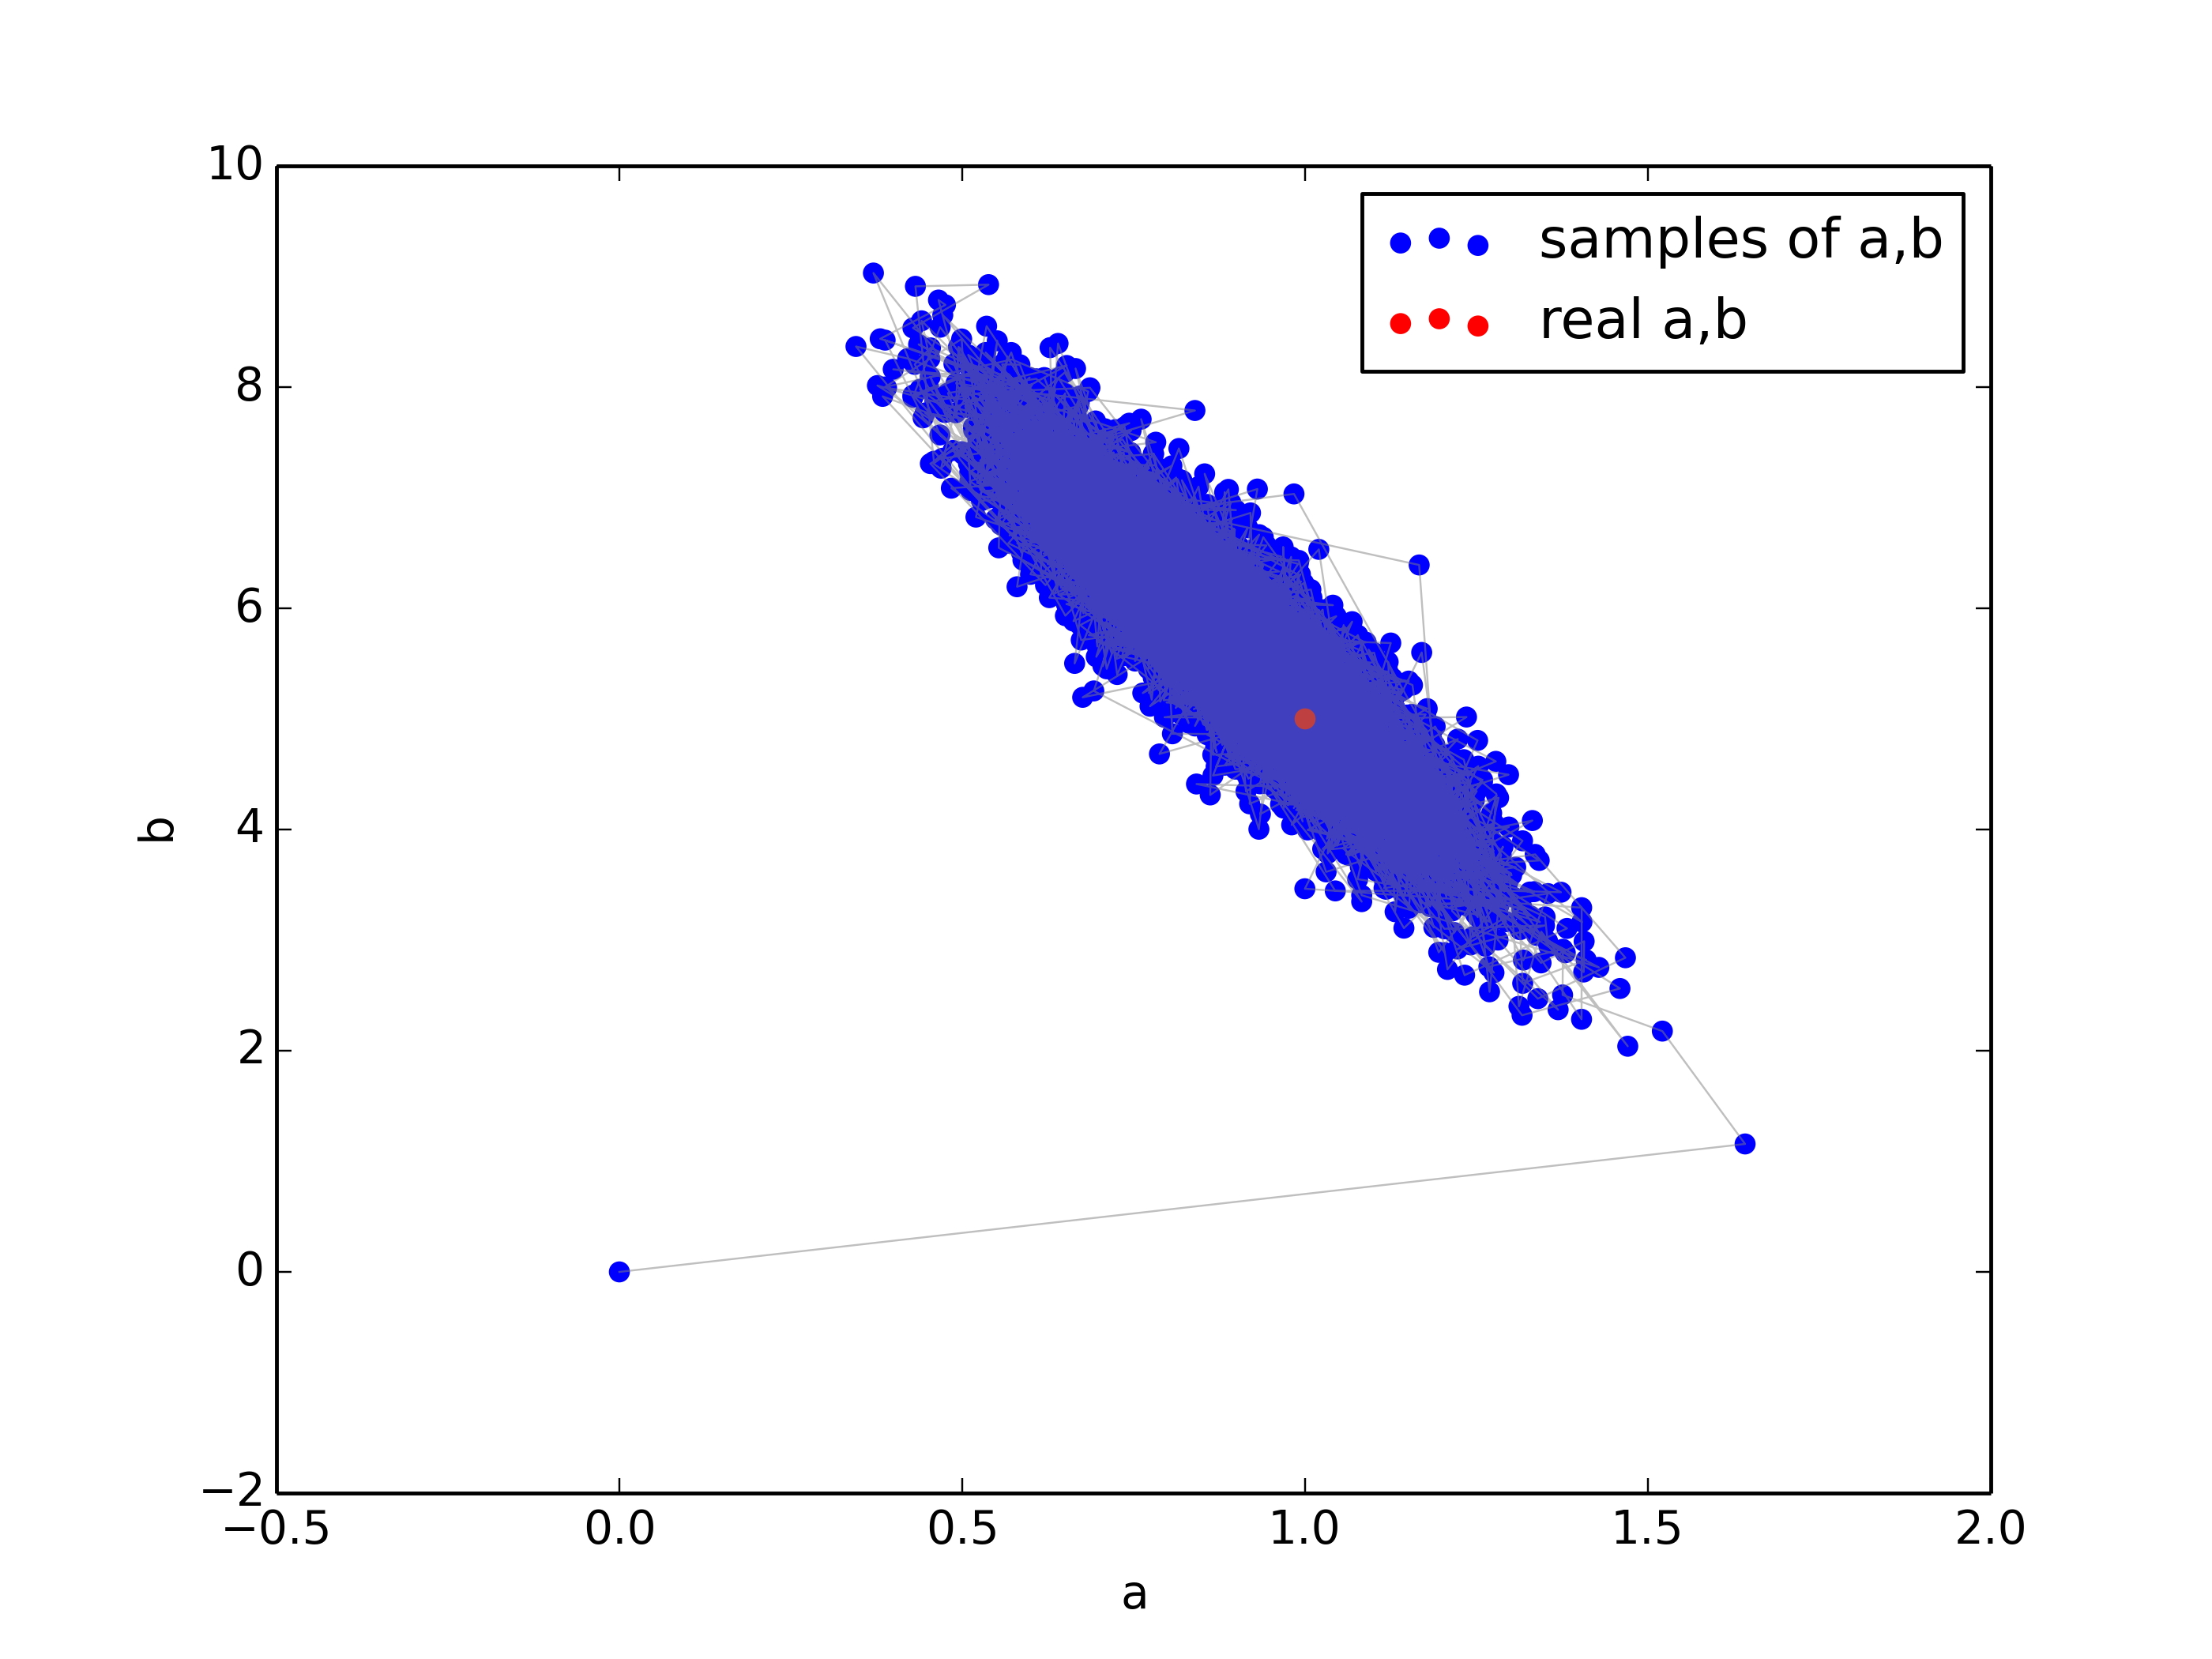
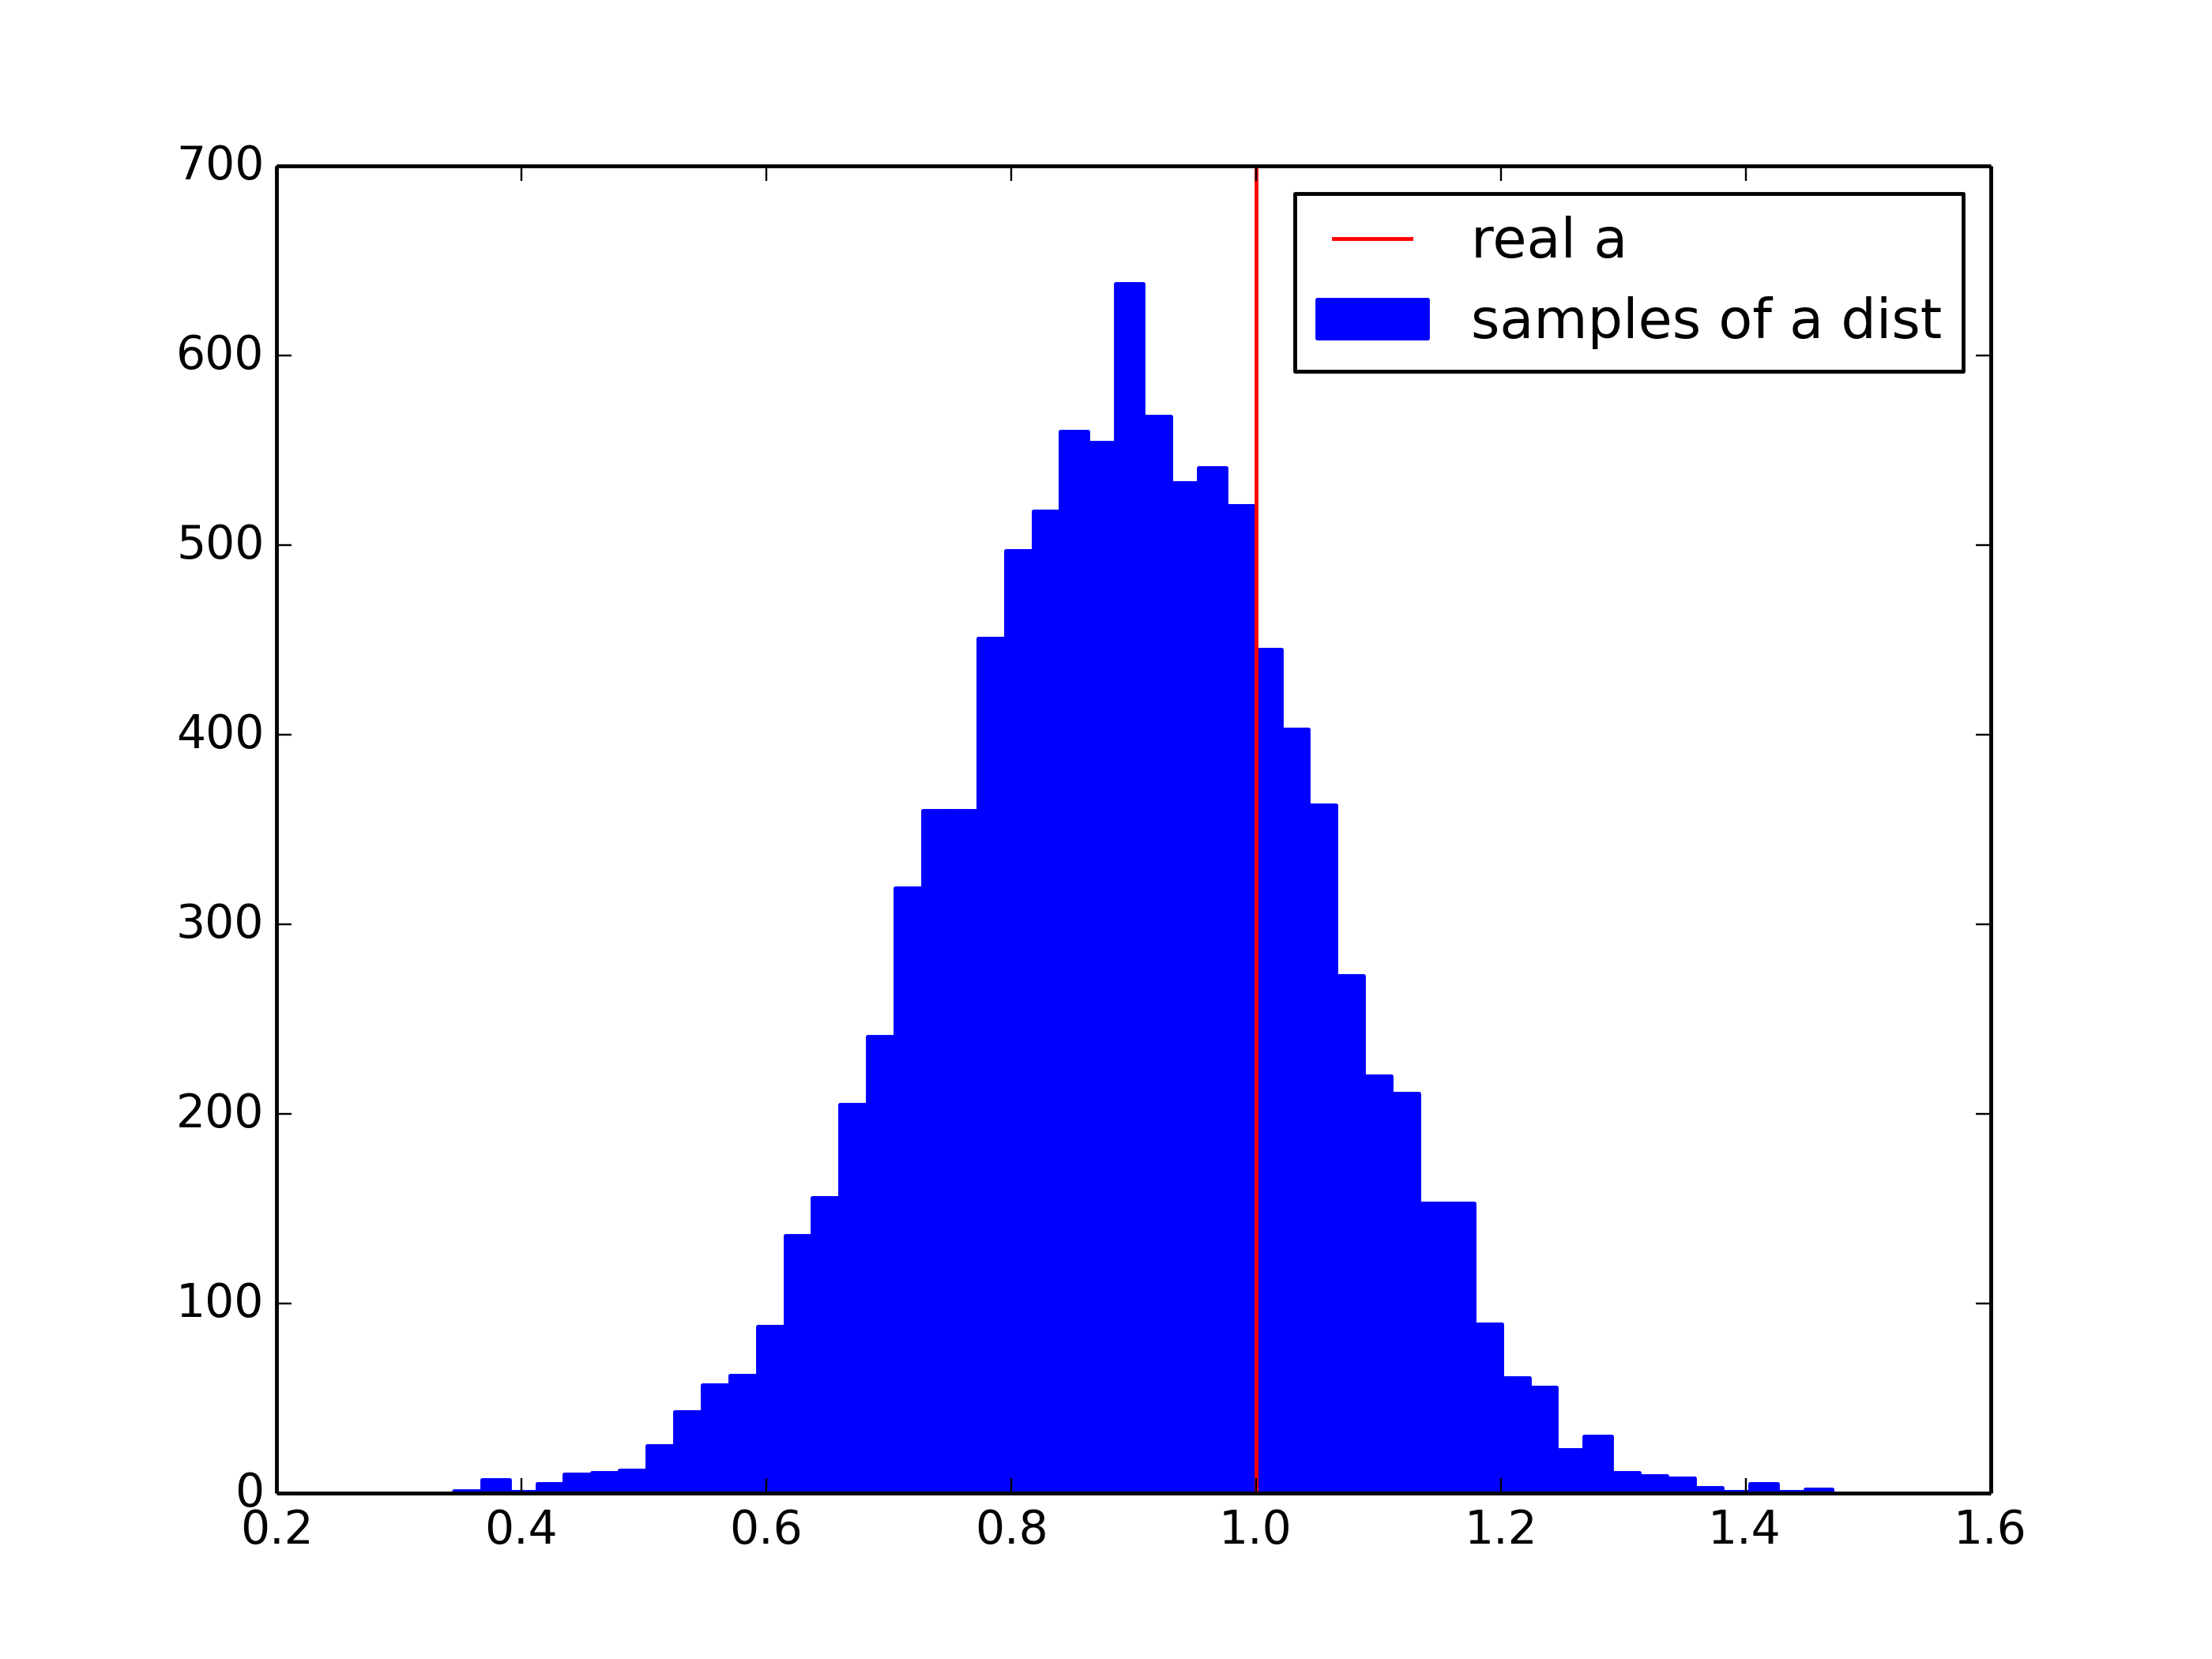
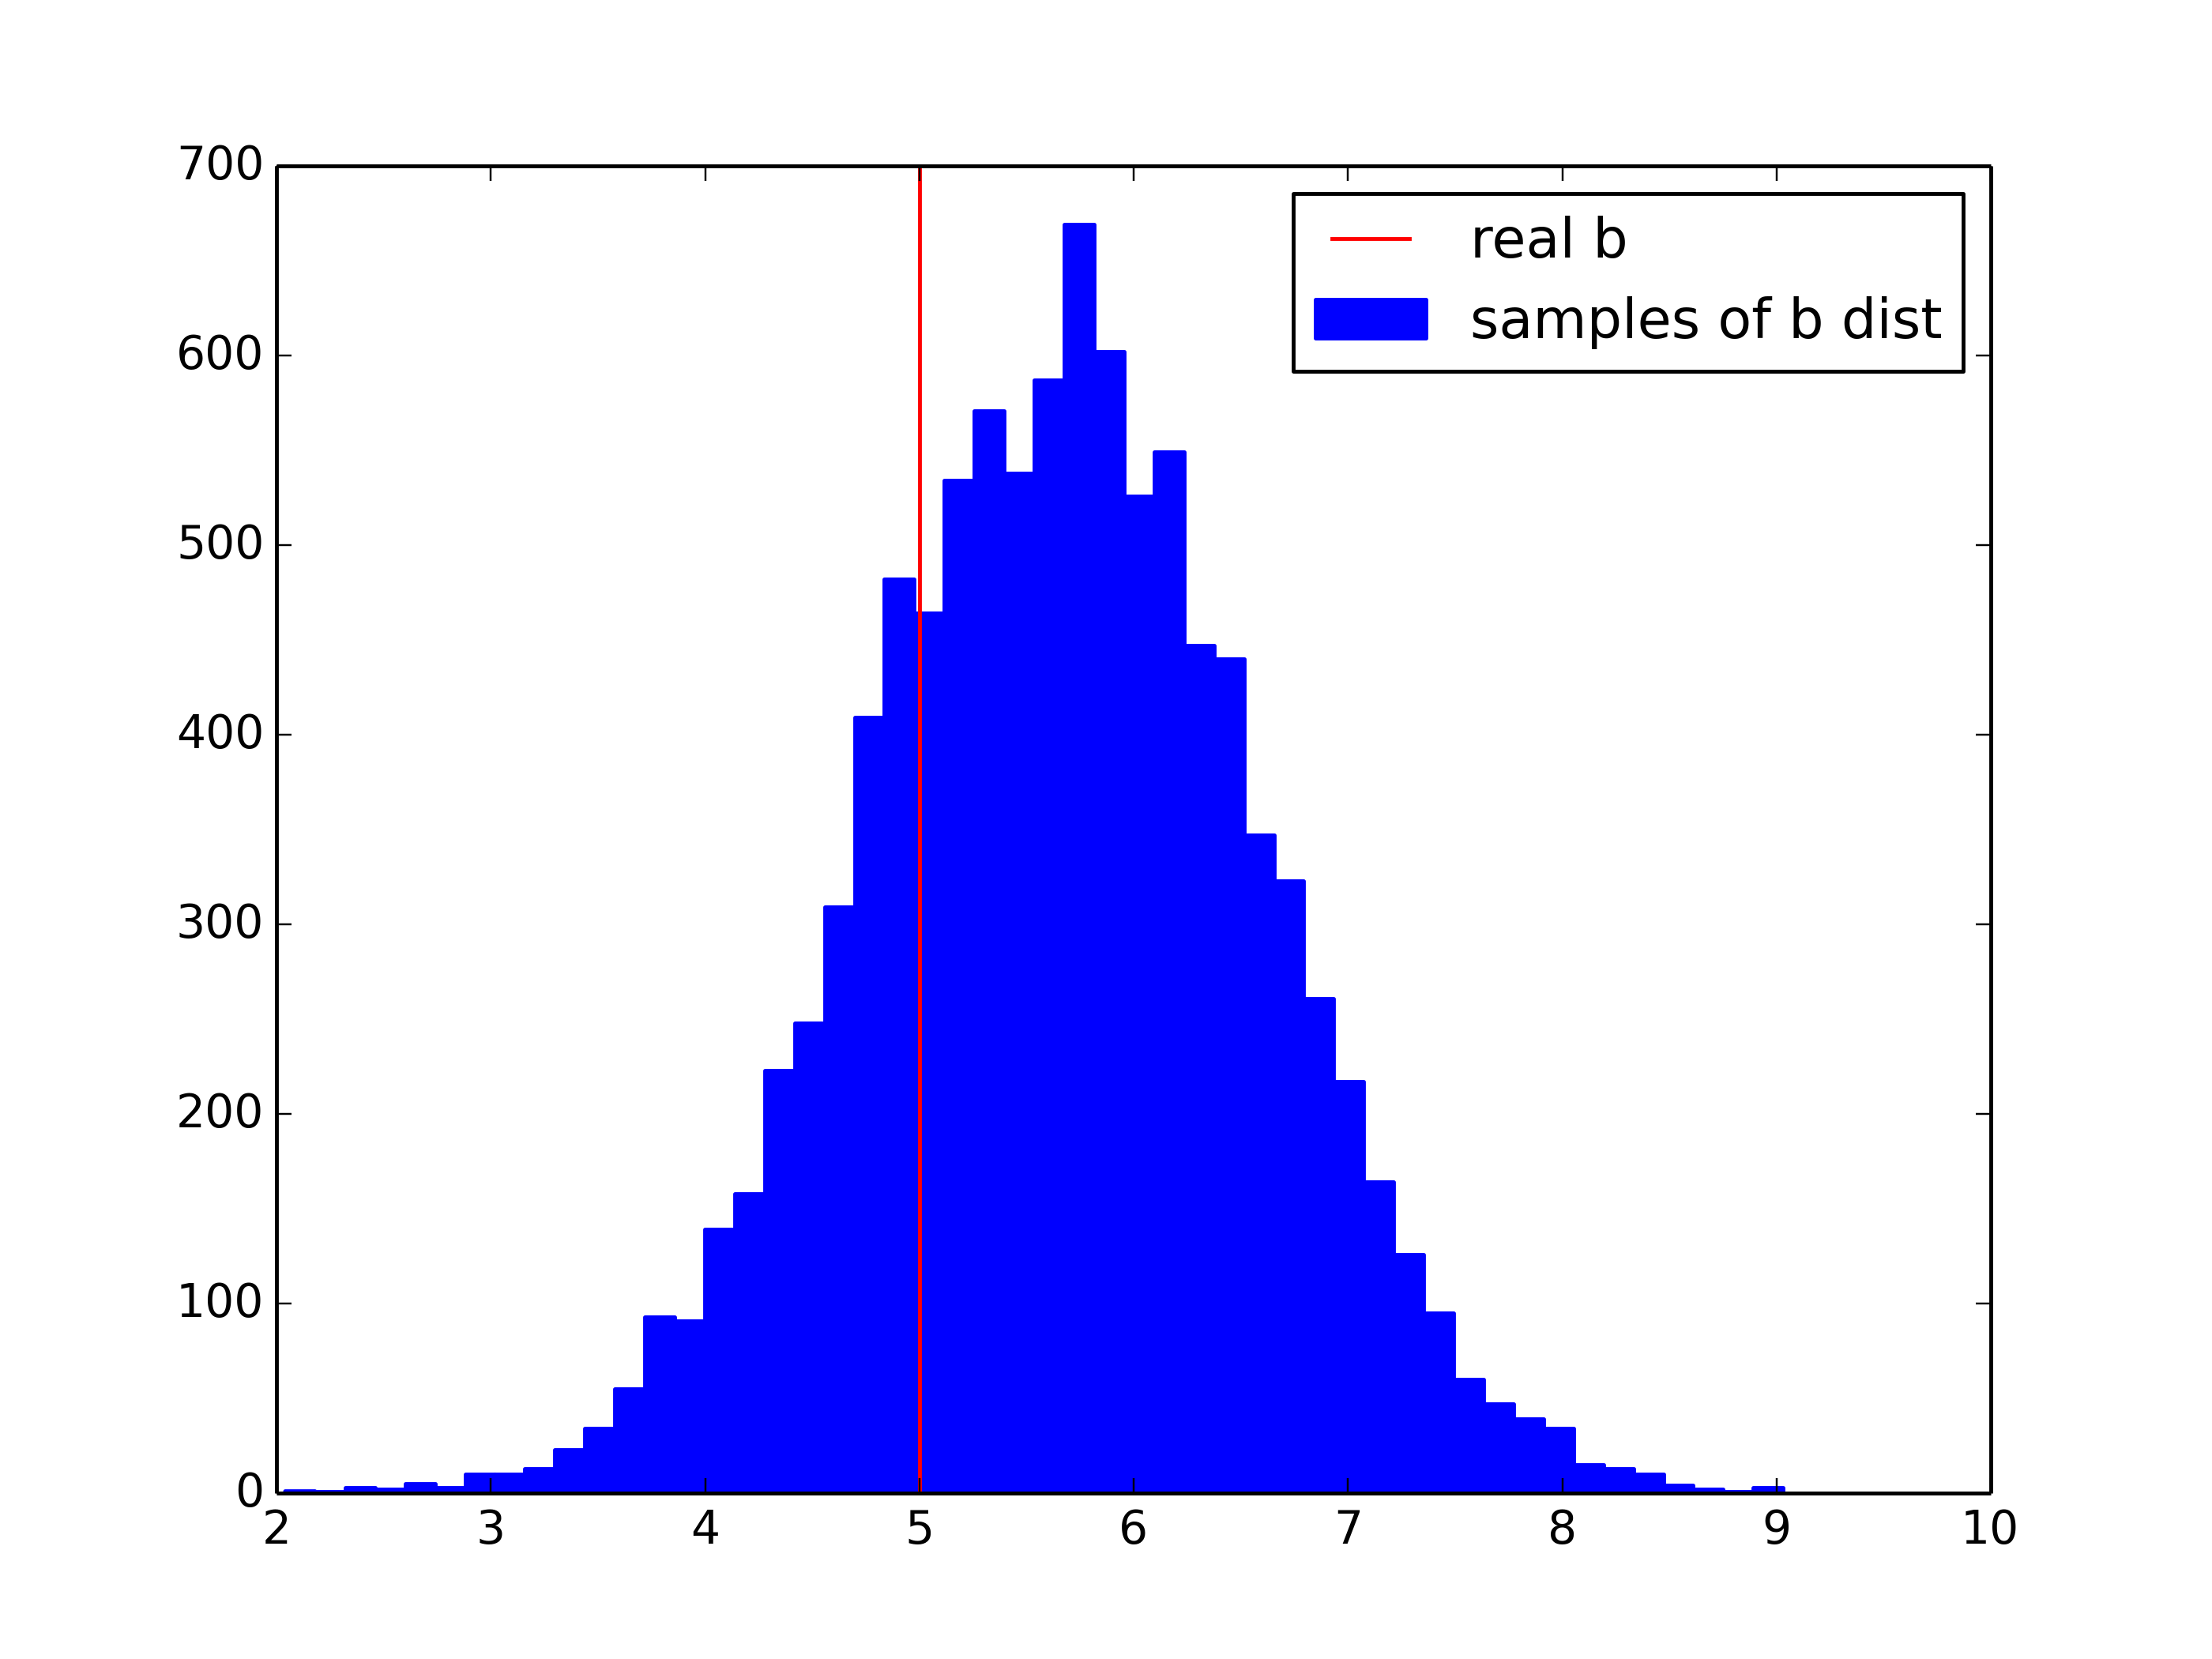
1-std posterior:
Reference
wiki Fitting a straight line to data
Later check! Metropolis and Gibbs Sampling
