Entropy & KL Divergence
Entropy
Entropy gives us a way to quantify the information content of a given probability distribution
         n
H(X) = - Σ p(x_i) log p(x_i)
        i=1
Suppose we have a simple probability distribution over the likelihood of a coin flip resulting in heads or tails [p,1-p]
Plugging [p,1-p] into H(X), we have
H(X) = - [plogp+(1-p)log(1-p)]

p=0.5  H(x)=0.69   entropy peak high   more info
p=0.9  H(x)=0.32
p->1   H(x)->0     entropy low         no info    - events that always occur contain no info
Return to definition of H(X):
         n                     n              1
H(X) = - Σ p(x_i) log p(x_i) = Σ p(x_i) log -----
        i=1                   i=1           p(x_i)
Cross Entropy
Cross Entropy is used to quantify the information content of one distribution p relative to another q
                                             1
H(p,q) = - Σ p(x_i) log q(x_i) = Σ p(x) log ----
          x_i                    x          q(x)
KL Divergence
KL divergence (aka relative entropy) is a distance metric that quantifies the difference between two probability distributions
Useful in measuring loss in machine learning, related to cross-entropy
Useful in dealing with a complex distribution scenario:
Rather than working with the distribution directly, we can use another distribution with well known properties (i.e. Gaussian) that does a decent job of describing the data
Simply put, we can use the KL divergence to tell whether a poisson distribution or a normal distribution is a better one at approximating the data
KL divergence is also a key component of Gaussian Mixture Models and t-SNE
Recall entropy and cross entropy:
H(p,q) - the amount of information needed to encode p and q
H(p) - the amount of information necessary to encode p
KL(p||q) - the amount of info needed to encode p with q minus the amount of info to encode p

                                                                       p(x)
KL(p||q) = H(p,q) - H(p) = - Σ p(x)logq(x) + Σ p(x)logp(x) = Σ p(x)log ----
                             x               x               x         q(x)
For distributions p and q of a discrete random variable,
                       p(x)
 KL(p||q) = Σ p(x) log ---- dx
                       q(x)
For distributions p and q of a continuous random variable,
                      p(x)
KL(p||q) = ∫ p(x) log ---- dx
                      q(x)
Notes:
- KL divergence is not symmetrical: KL(p||q)!=KL(q||p)
- the lower the KL divergence, the closer the two distributions are to one another
python Examples
For discrete cases, generate red ball 40%, and blue ball 60%
import numpy as np
from collections import Counter

def generate_balls(n):
    #generate uni random in [0.0, 1.0)
    bag=np.random.random(n)
    return ['red' if x<=0.4 else 'blue' for x in bag.tolist()]

def percentage(cnt):

    return [float(v)/np.sum(cnt.values()) for v in cnt.values()]

#fix the output
np.random.seed(8)
cnt10=Counter(generate_balls(10))
>>Counter({'blue': 5, 'red': 5})
cnt100=Counter(generate_balls(100))
>>Counter({'blue': 57, 'red': 43})
cnt1000=Counter(generate_balls(1000))
>>Counter({'blue': 585, 'red': 415})

p10=percentage(cnt10)
>>[0.5,0.5]
p100=percentate(cnt100)
>>[0.57,0.43]
p1000=percentage(cnt1000)
>>[0.585,0.415]

q=[0.6,0.4]

#handcraft
kl10=np.sum(np.array(p10)*np.log(p10/np.array(q)))
>>0.020410997260127586
kl100=np.sum(np.array(p100)*np.log(p100/np.array(q)))
>>0.001860706678335388
kl1000=np.sum(np.array(p1000)*np.log(p1000/np.array(q)))
>>0.0004668811751176276

#scipy lib
from scipy.stats import entropy
entropy(p10,q)
>>0.020410997260127586
entropy(p100,q)
>>0.001860706678335388
entropy(p1000,q)
>>0.0004668811751176276
For continuous cases, taking 2 Gaussian
p=N(0,2) and q=N(2,2) as example, their KL(p||q)=500;
p=N(0,2) and q=N(5,4) as example, their KL(p||q)=1099:
import numpy as np
import matplotlib.pyplot as plt
import tensorflow as tf
import seaborn as sns
#sns.set()

from scipy.stats import norm

#to avoid log 0, cuz log 0=-inf
#np.where means if p!=0, run p*np.log(p/q), else 0
def kl(p,q):
    return np.sum(np.where(p!=0,p*np.log(p/q),0))

x=np.arange(-10,10,0.001)
p=norm.pdf(x,0,2)
q=norm.pdf(x,2,2)

plt.figure()
plt.title('KL(p||q)=%1.3f' % kl(p,q))
plt.plot(x,p,'b',label='p with m=0,std=2')
plt.plot(x,q,'r',label='q with m=2,std=2')
plt.legend()
plt.savefig('kl_norm2.png',dpi=350)
plt.clf()

q=norm.pdf(x,5,4)
plt.figure()
plt.title('KL(p||q)=%1.3f' % kl(p,q))
plt.plot(x,p,'b',label='p with m=0,std=2')
plt.plot(x,q,'r',label='q with m=5,std=4')
plt.legend()
plt.savefig('kl_norm2_.png',dpi=350)
plt.clf()
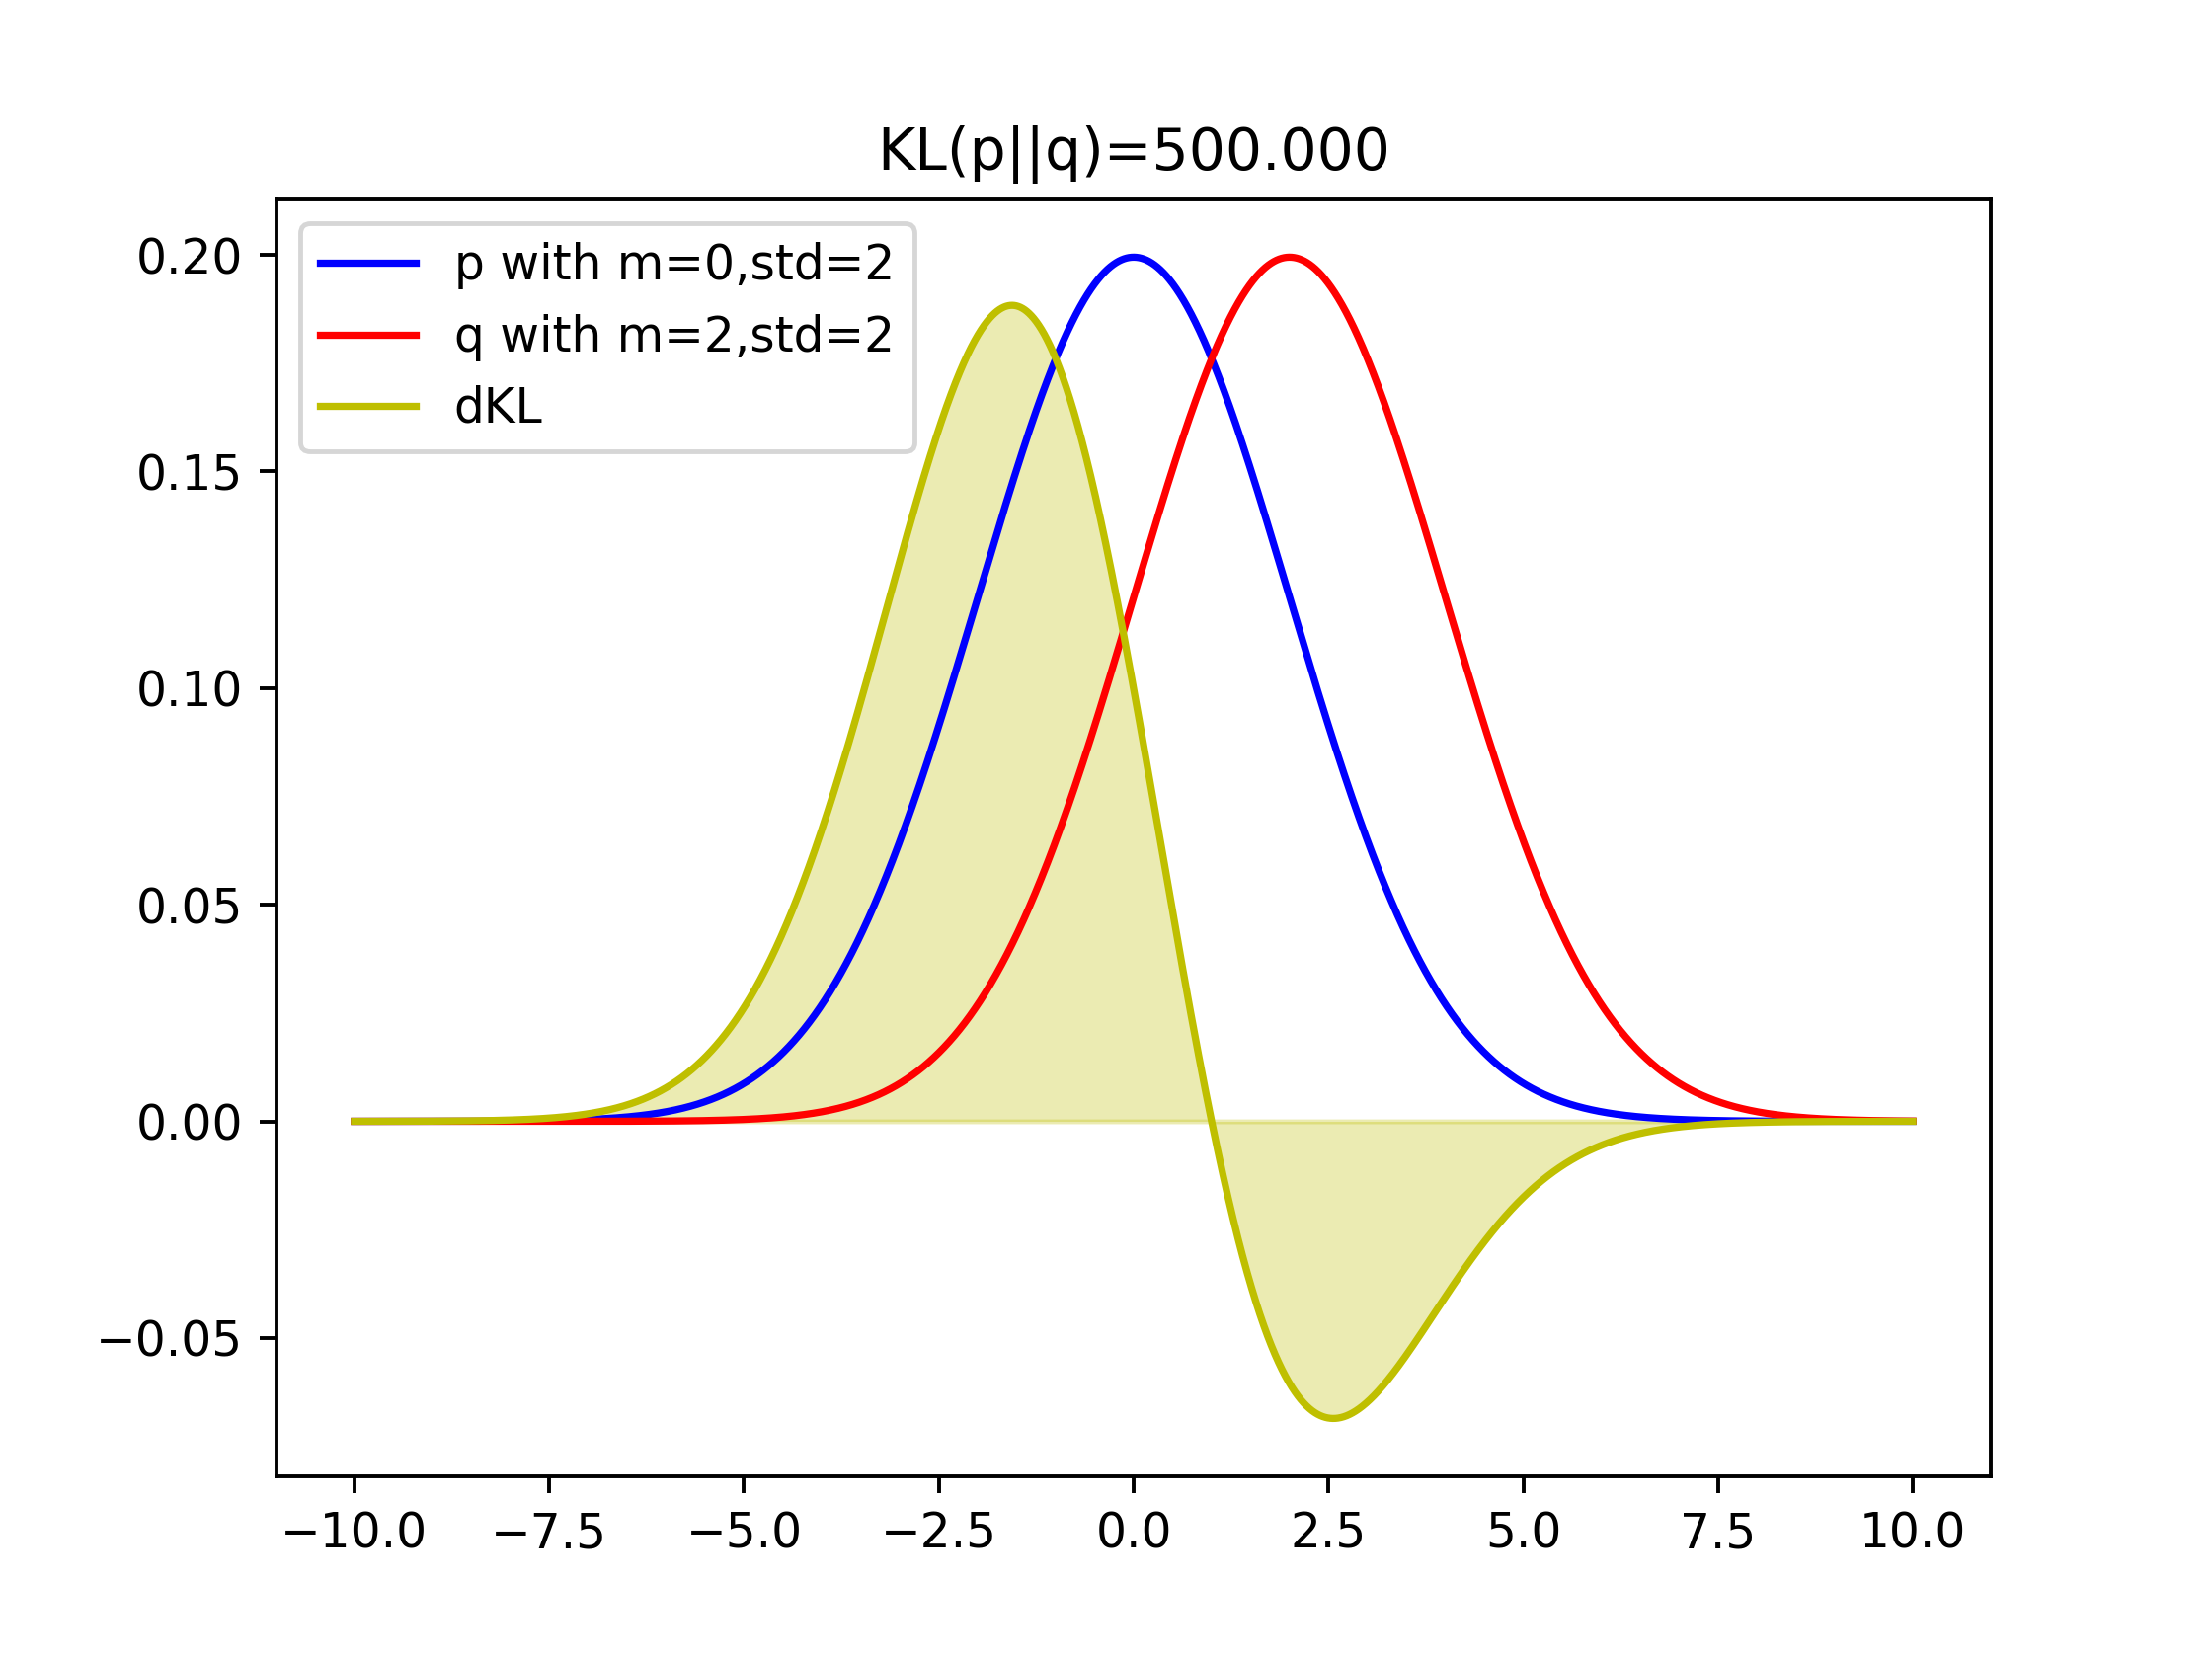
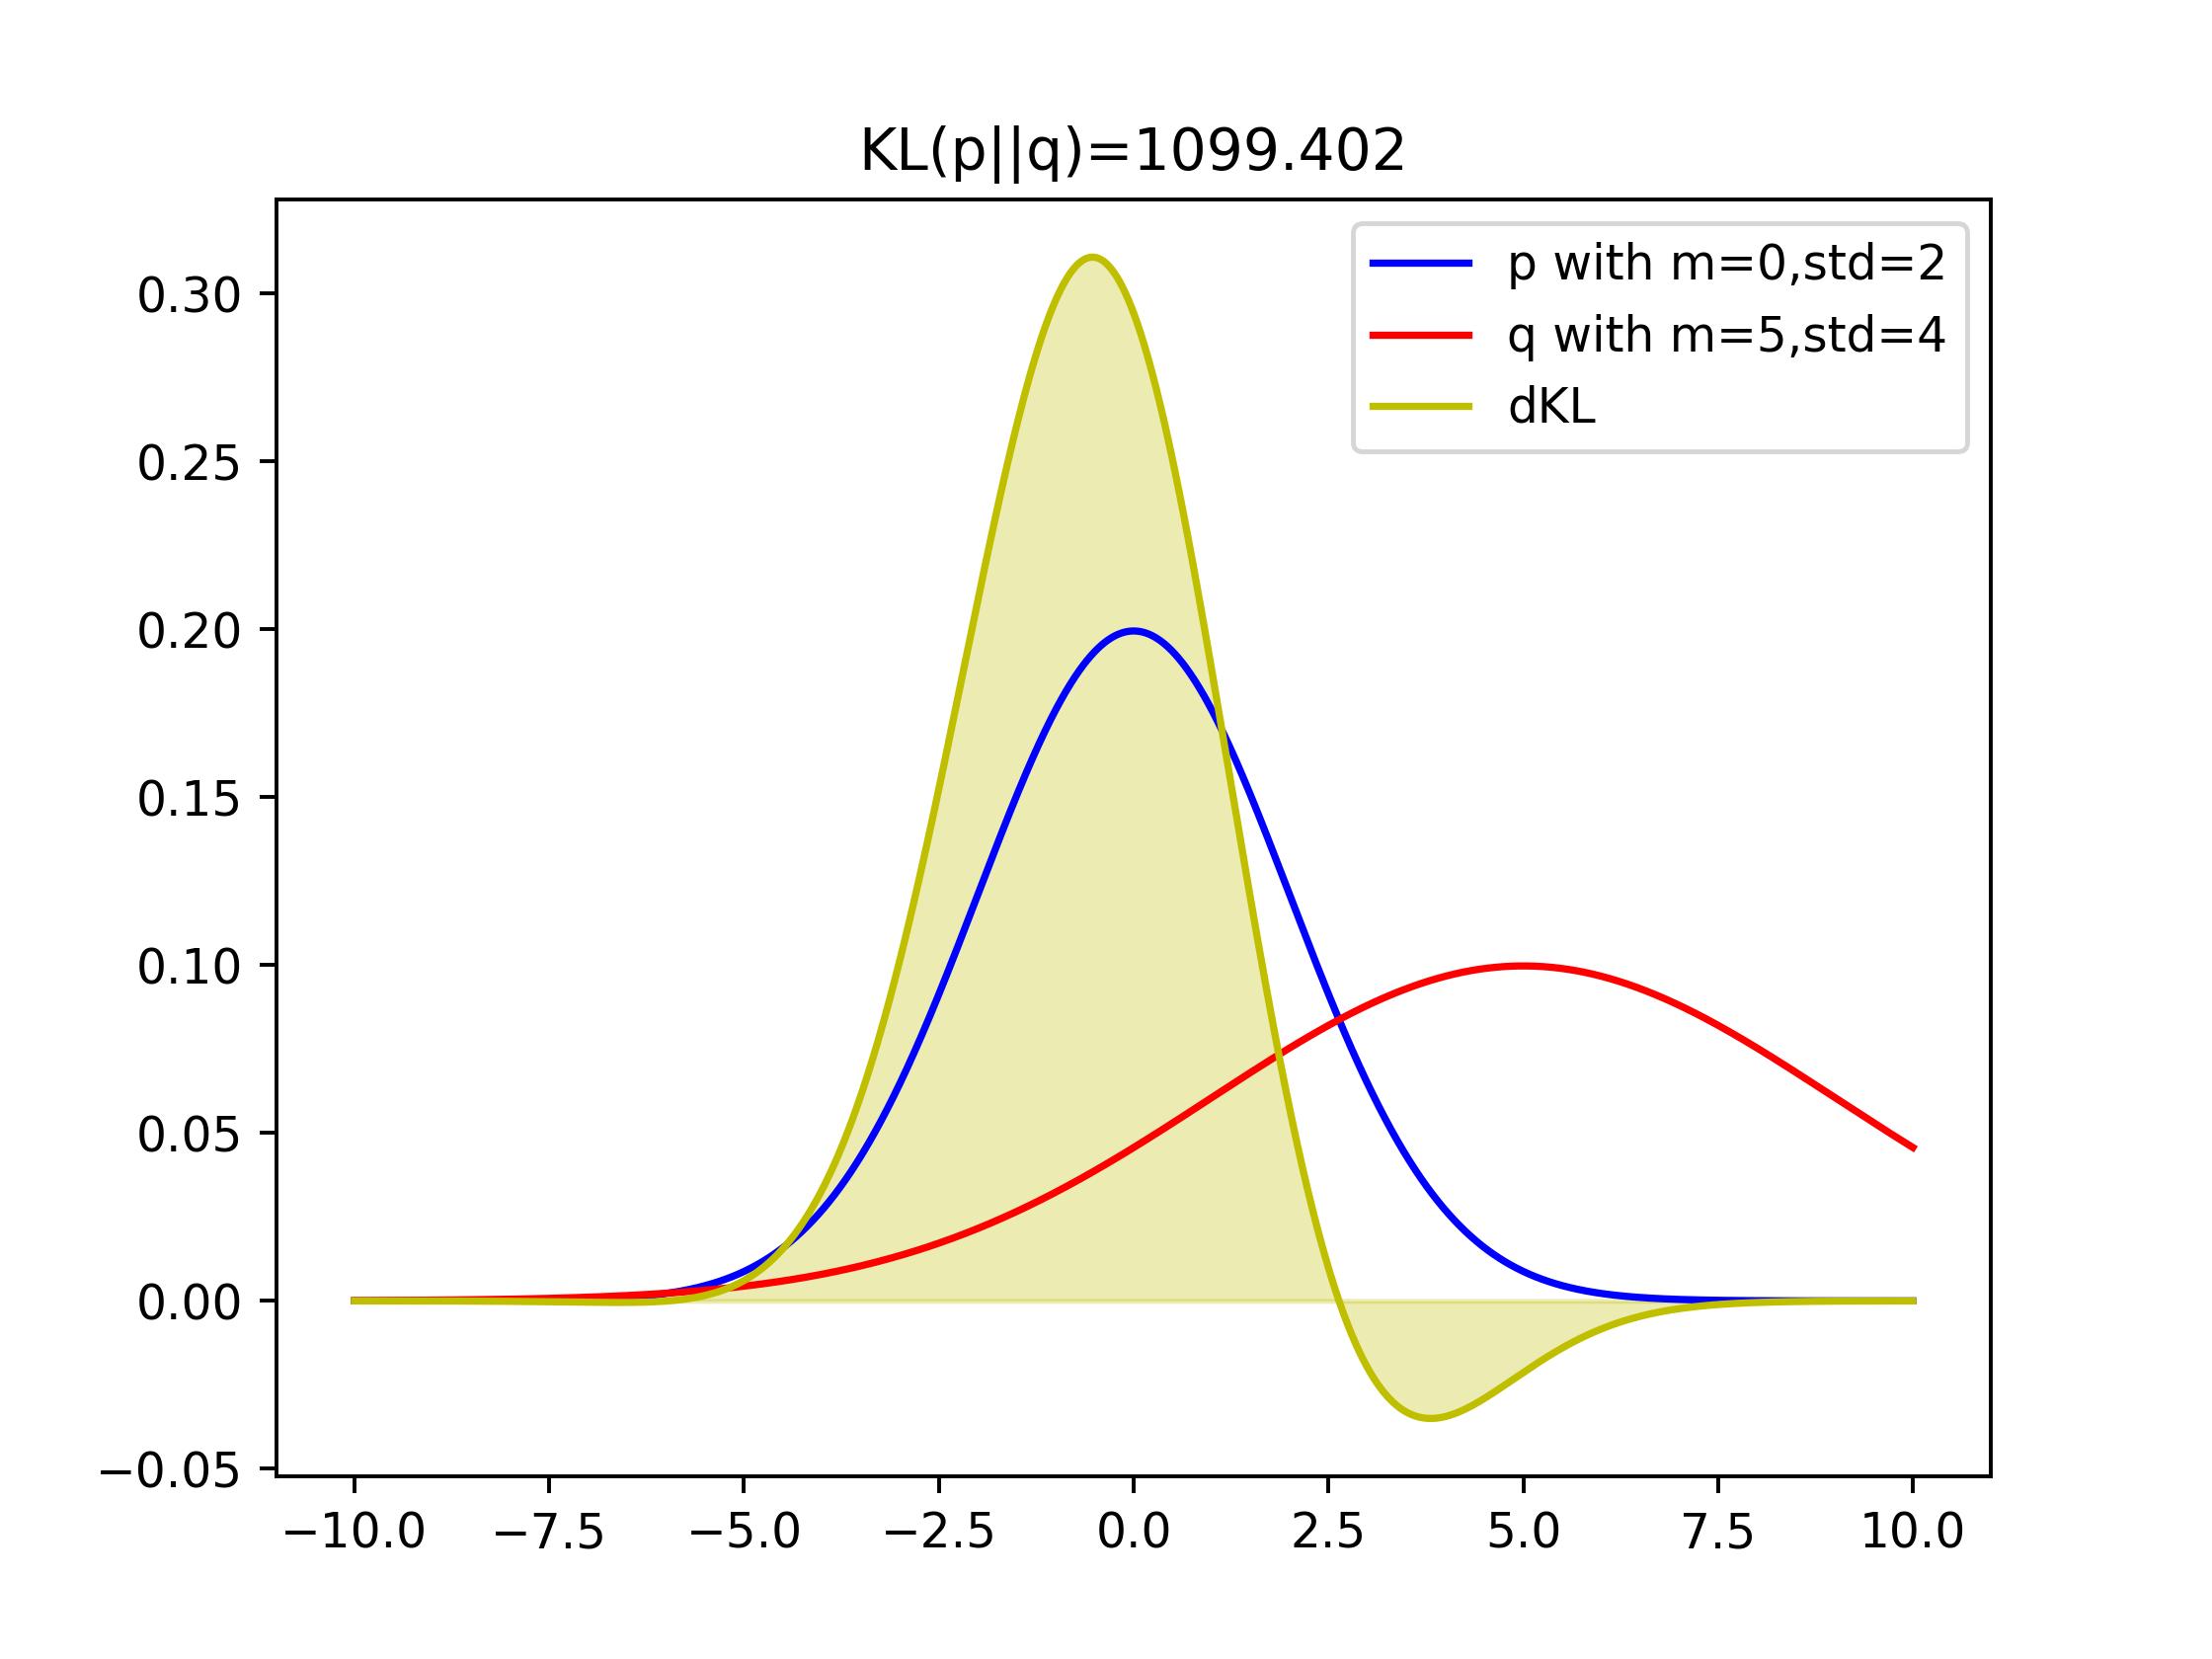
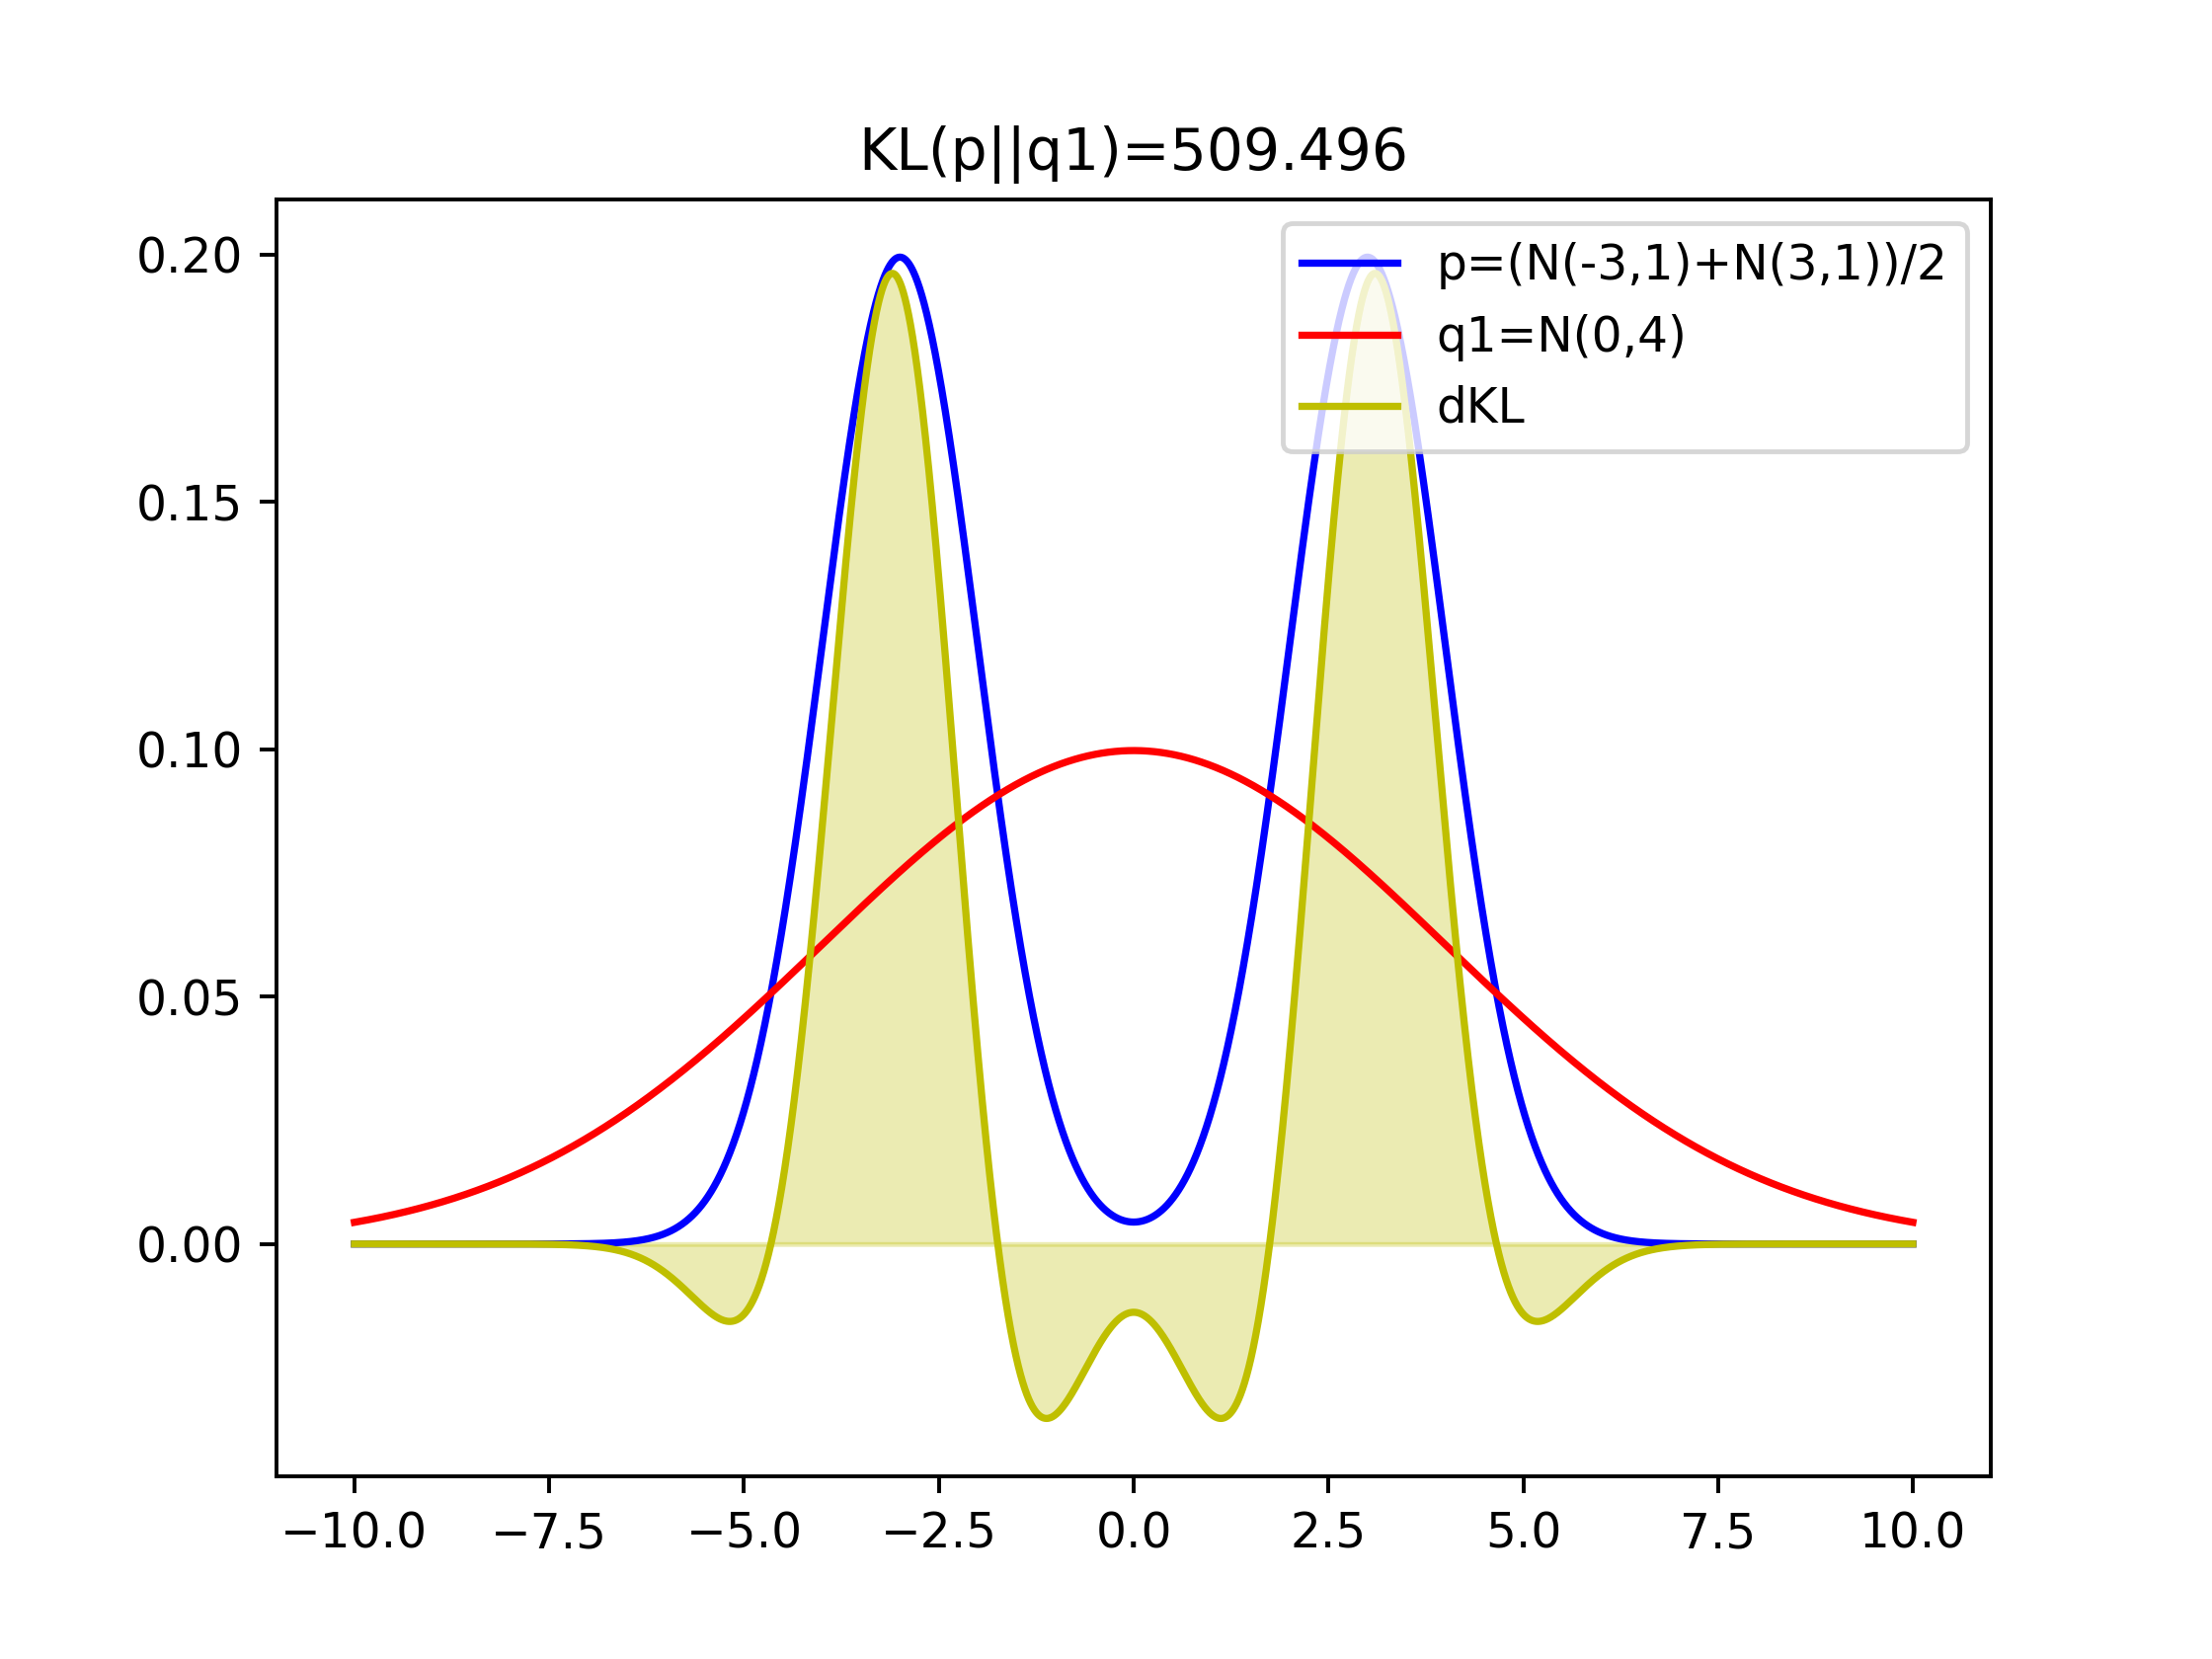
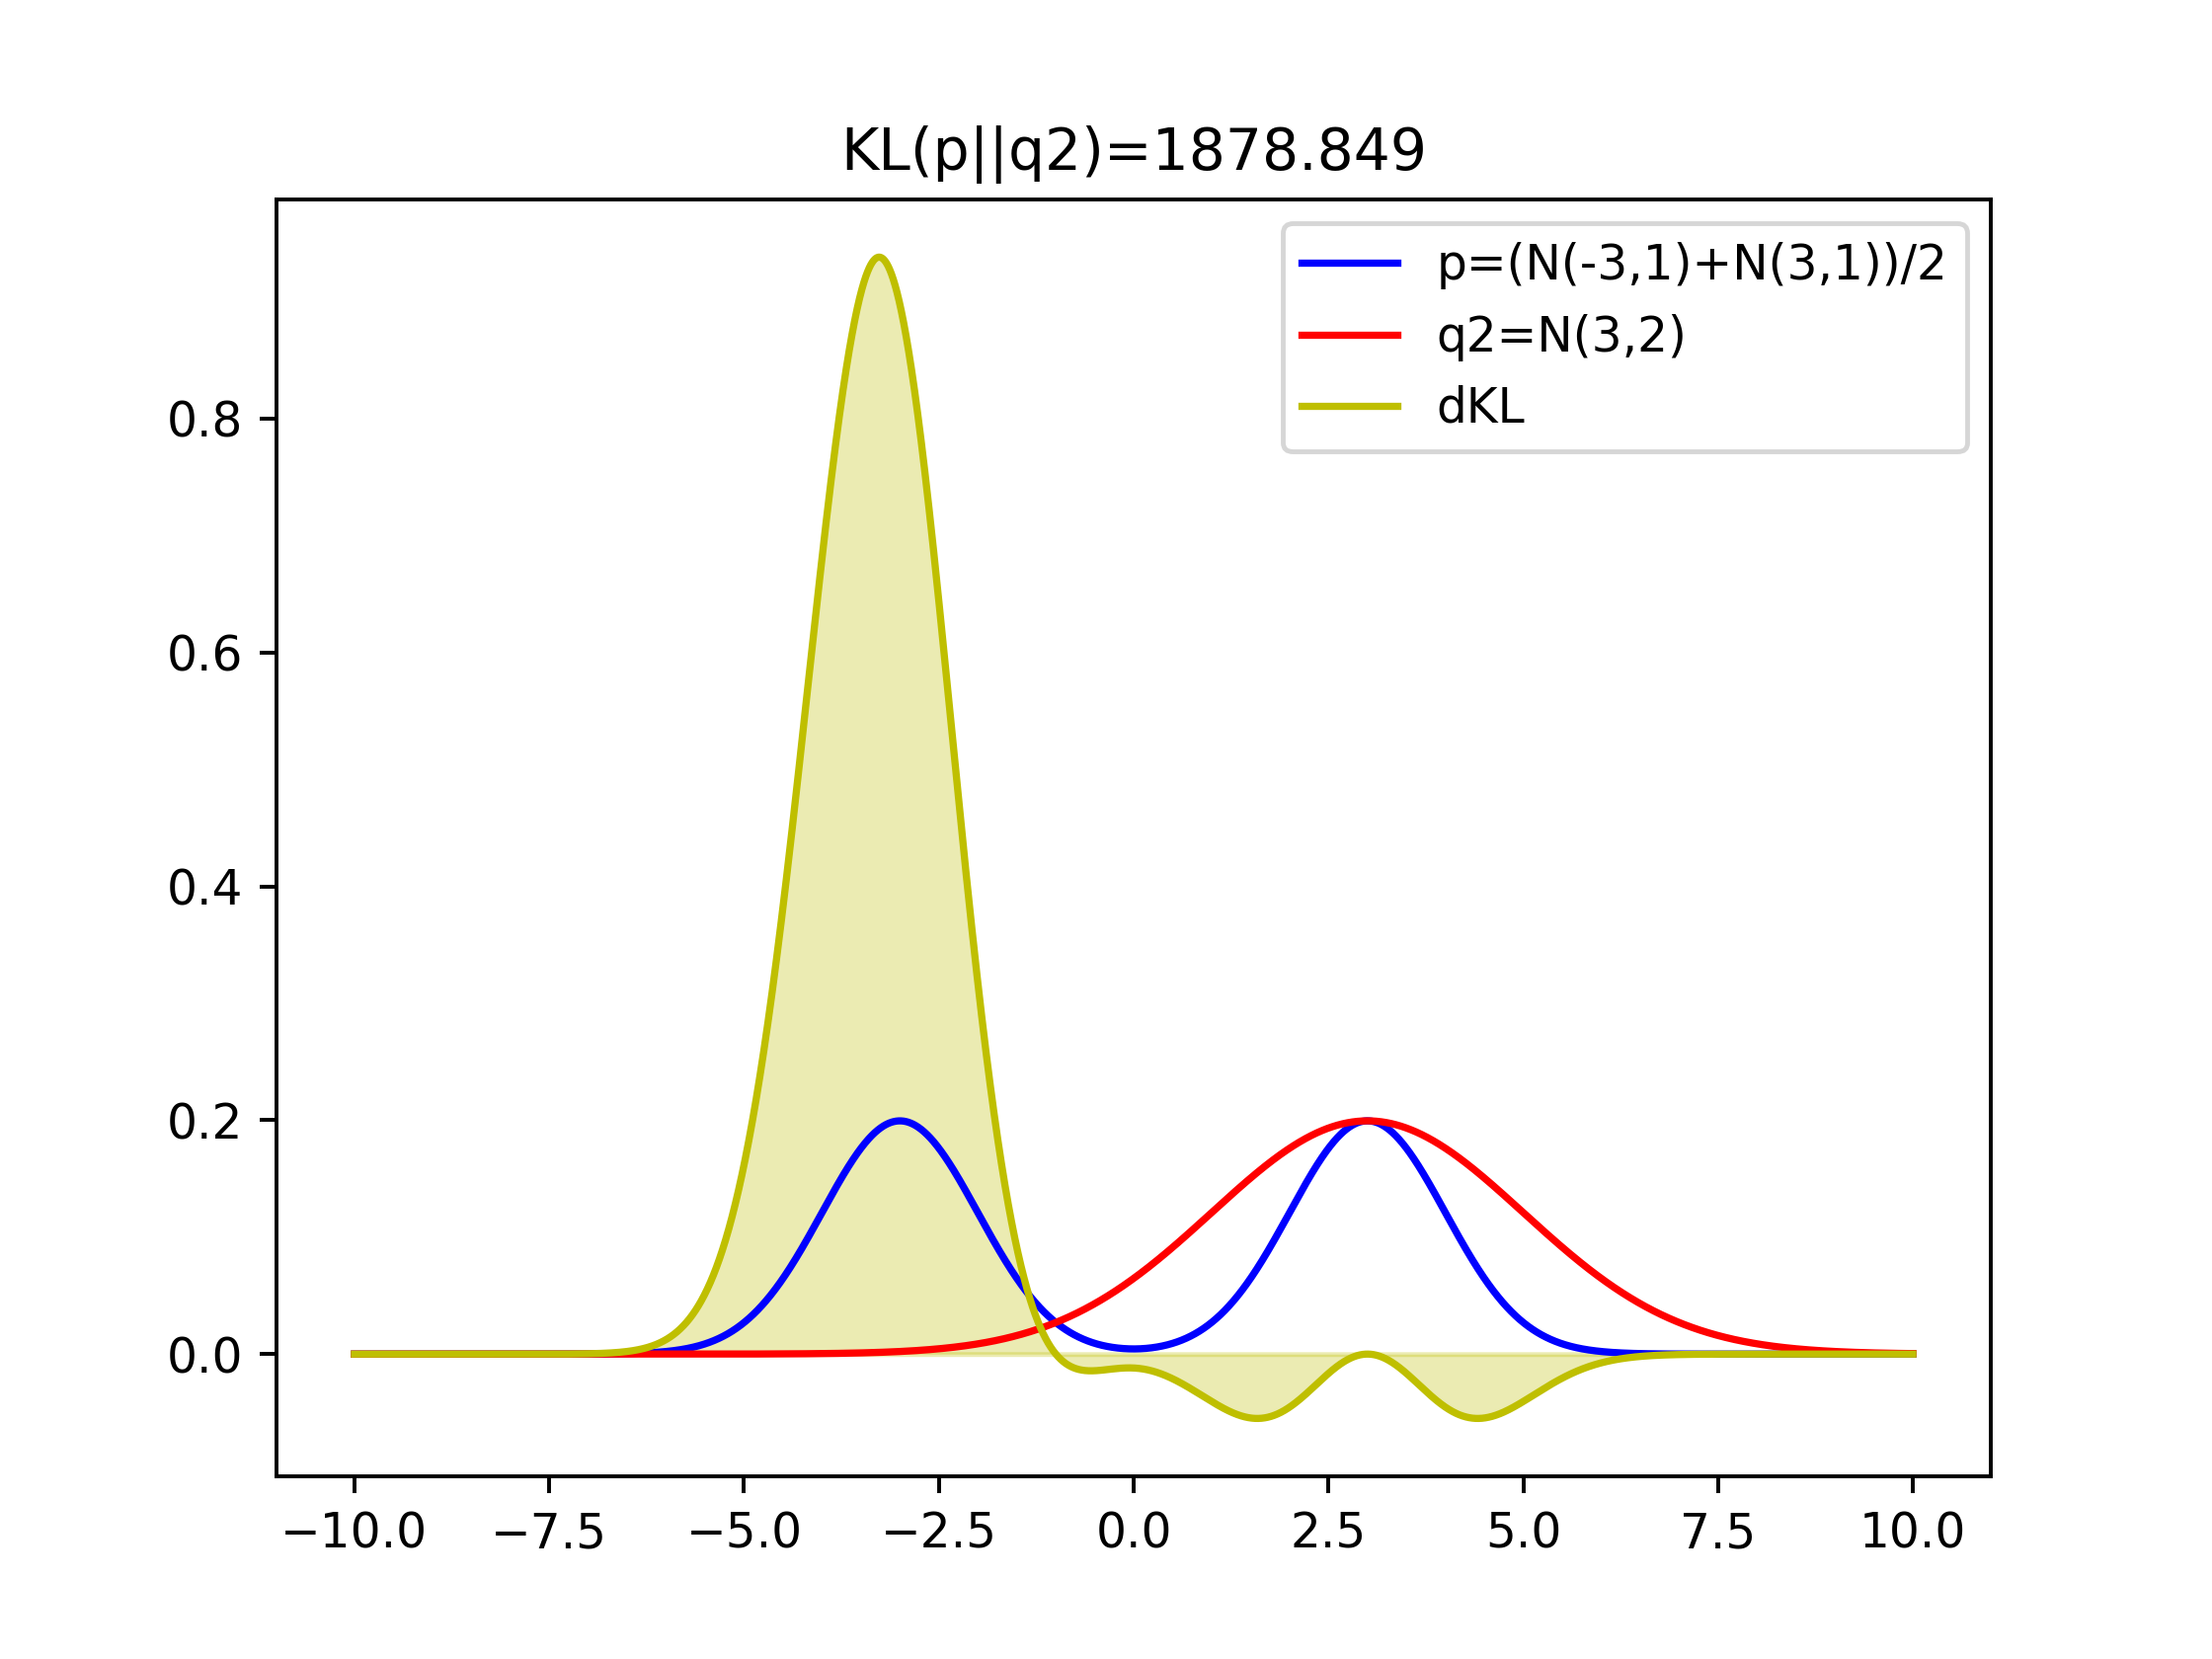
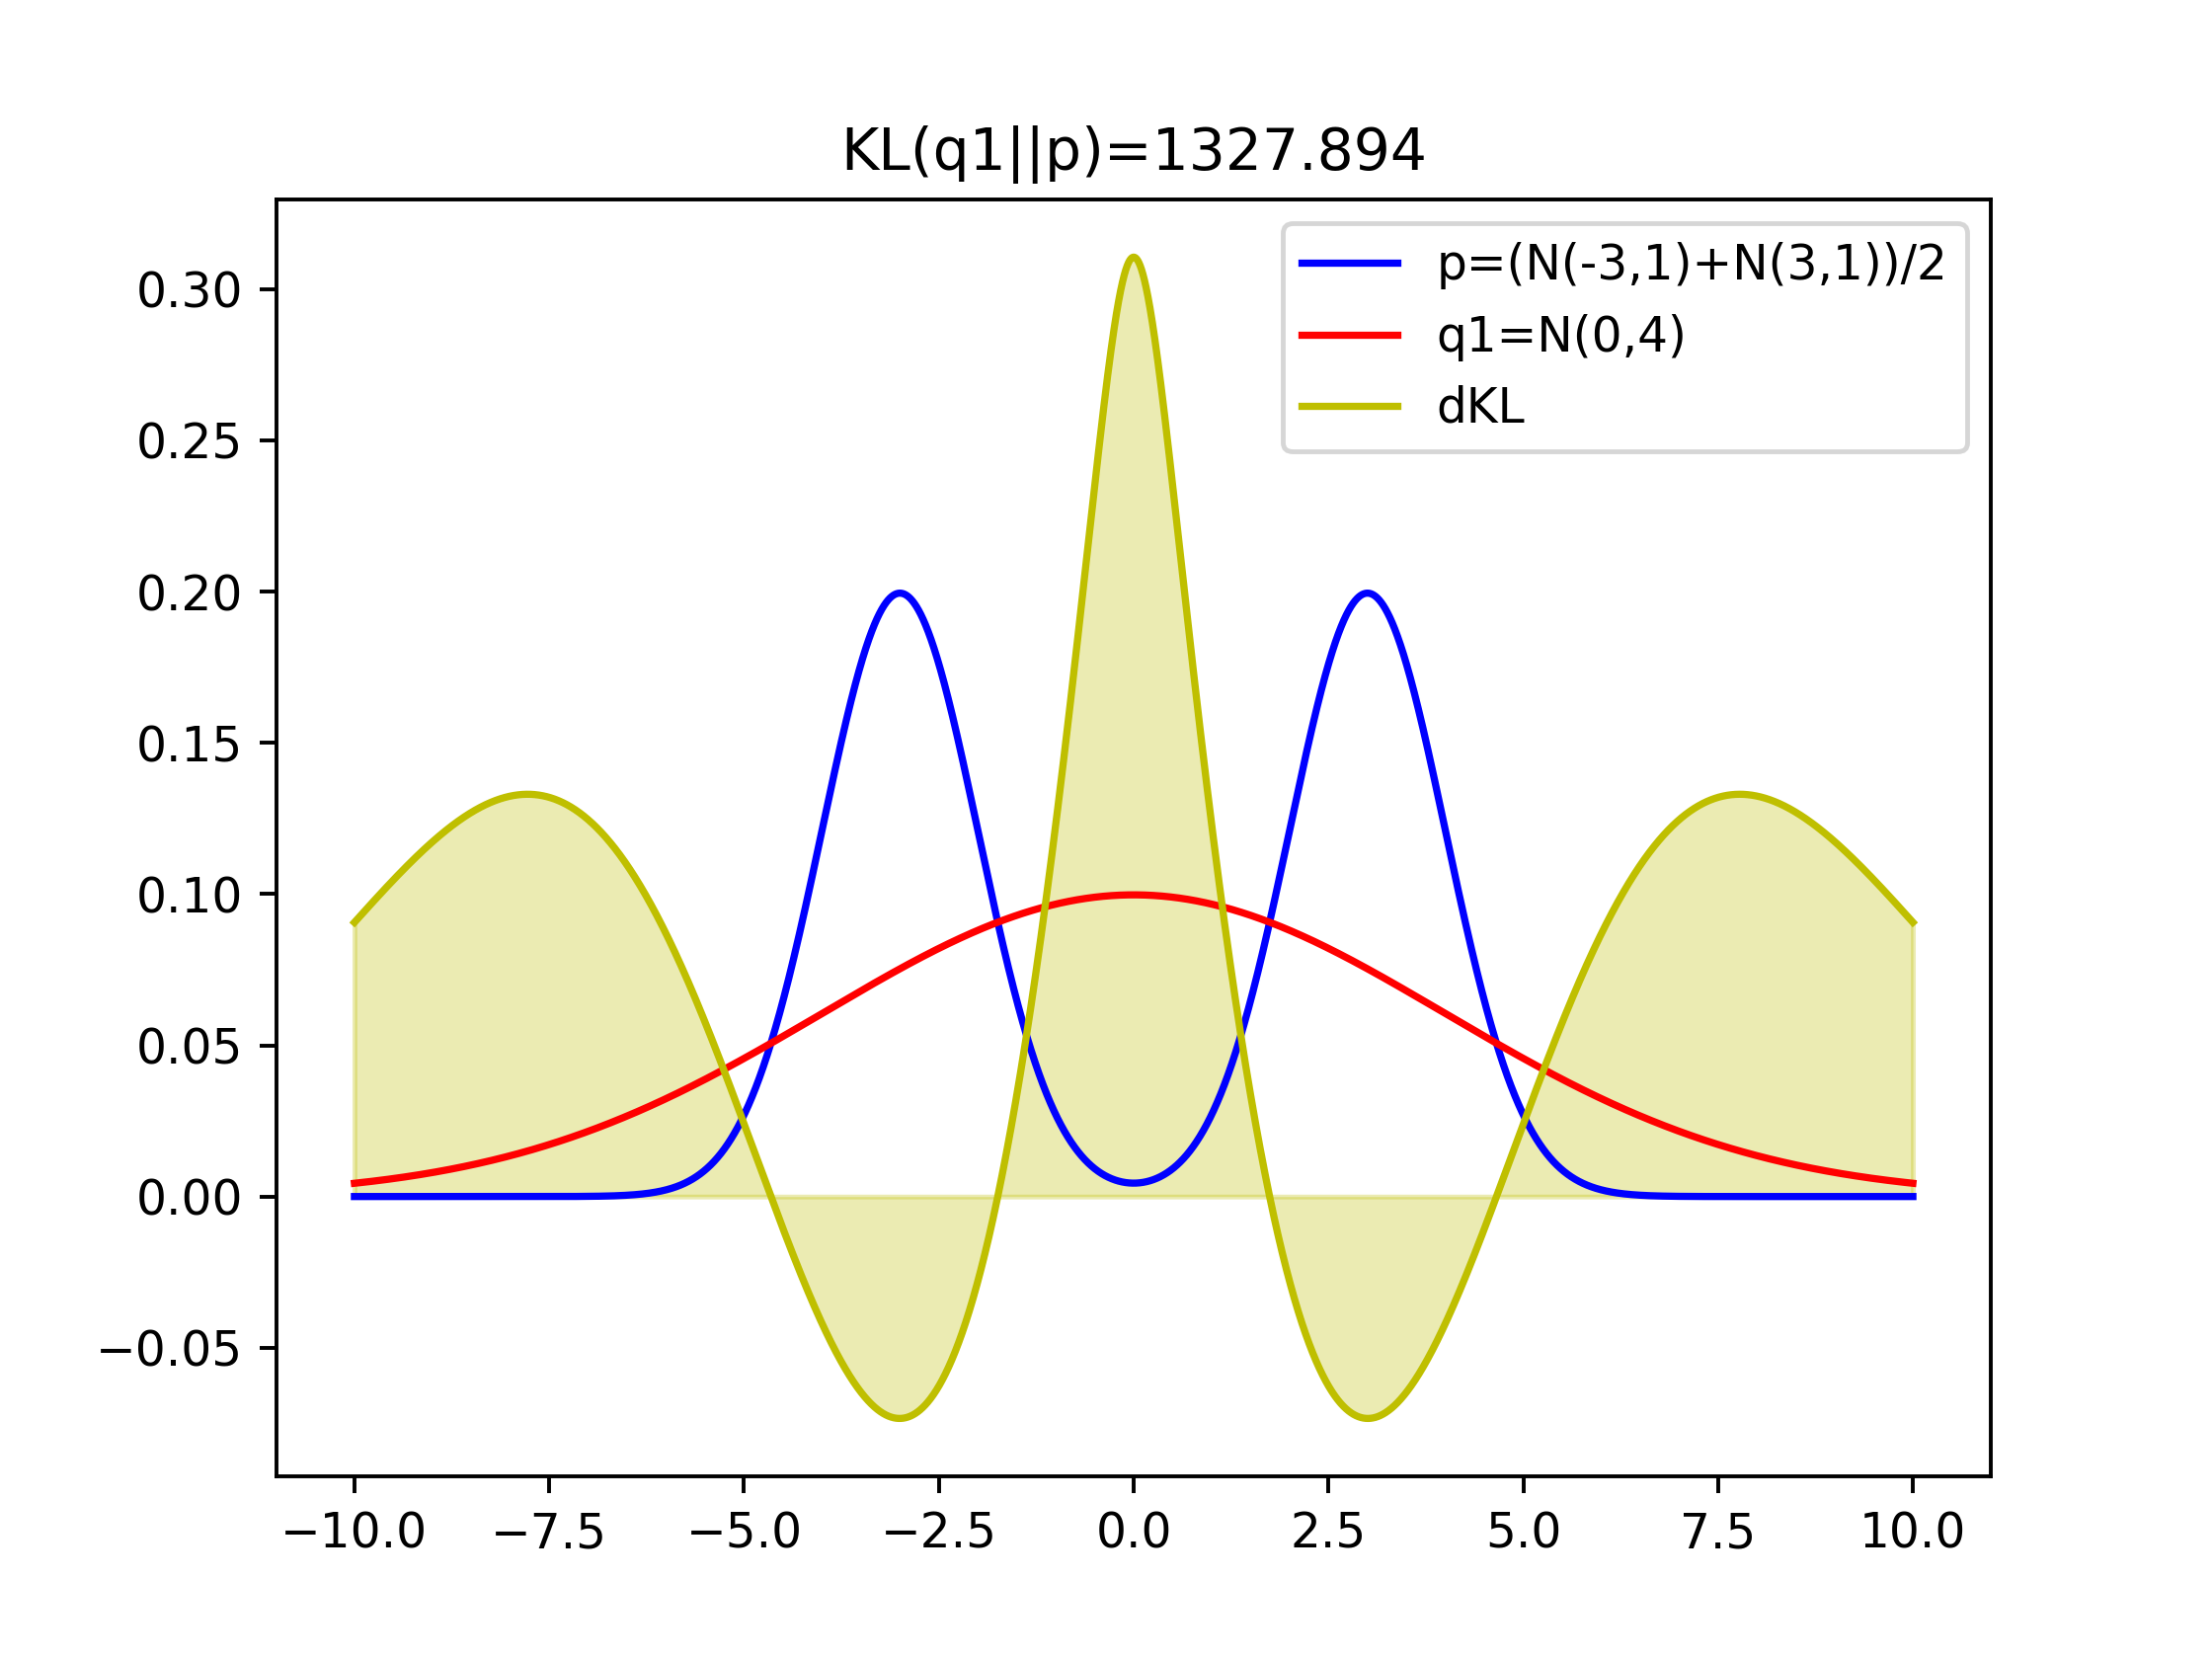
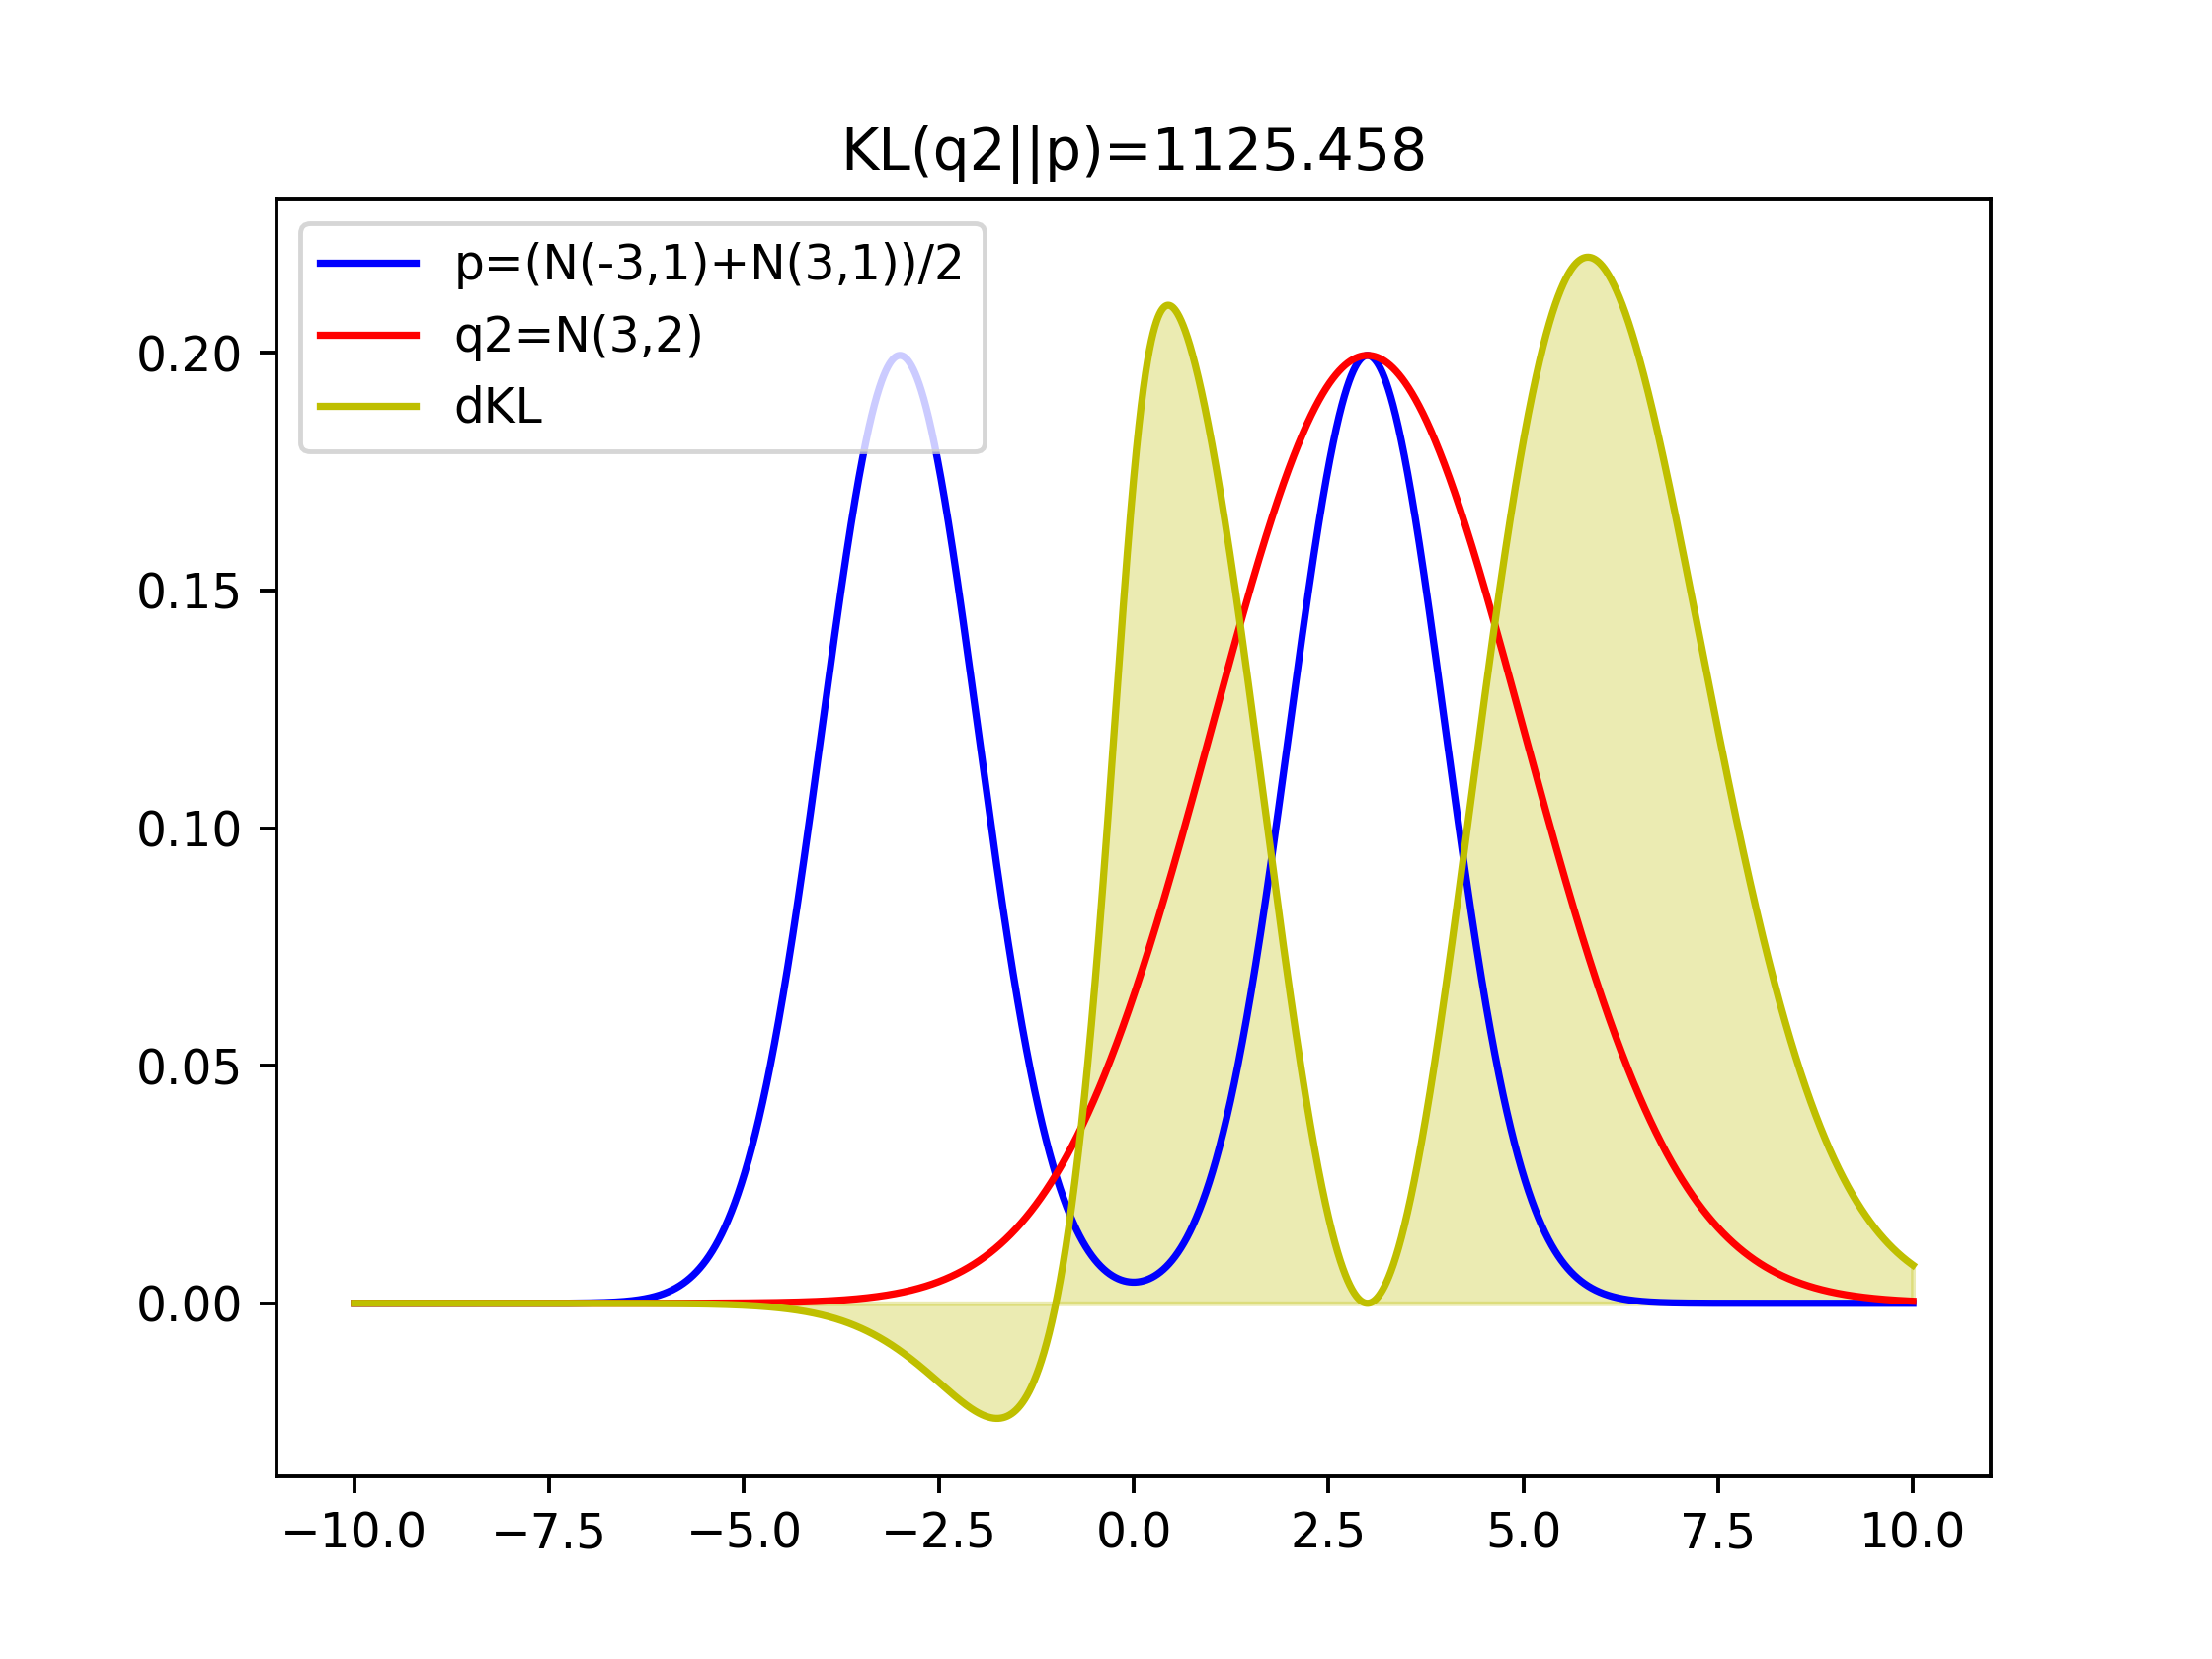
Comparison of KLs of covering two-modal Gaussian and one-model Gaussian
Figure 1 with q1=N(0,4) that covers both two modal has the lowest value of KL(p||q1)
Minimizing KL Divergence
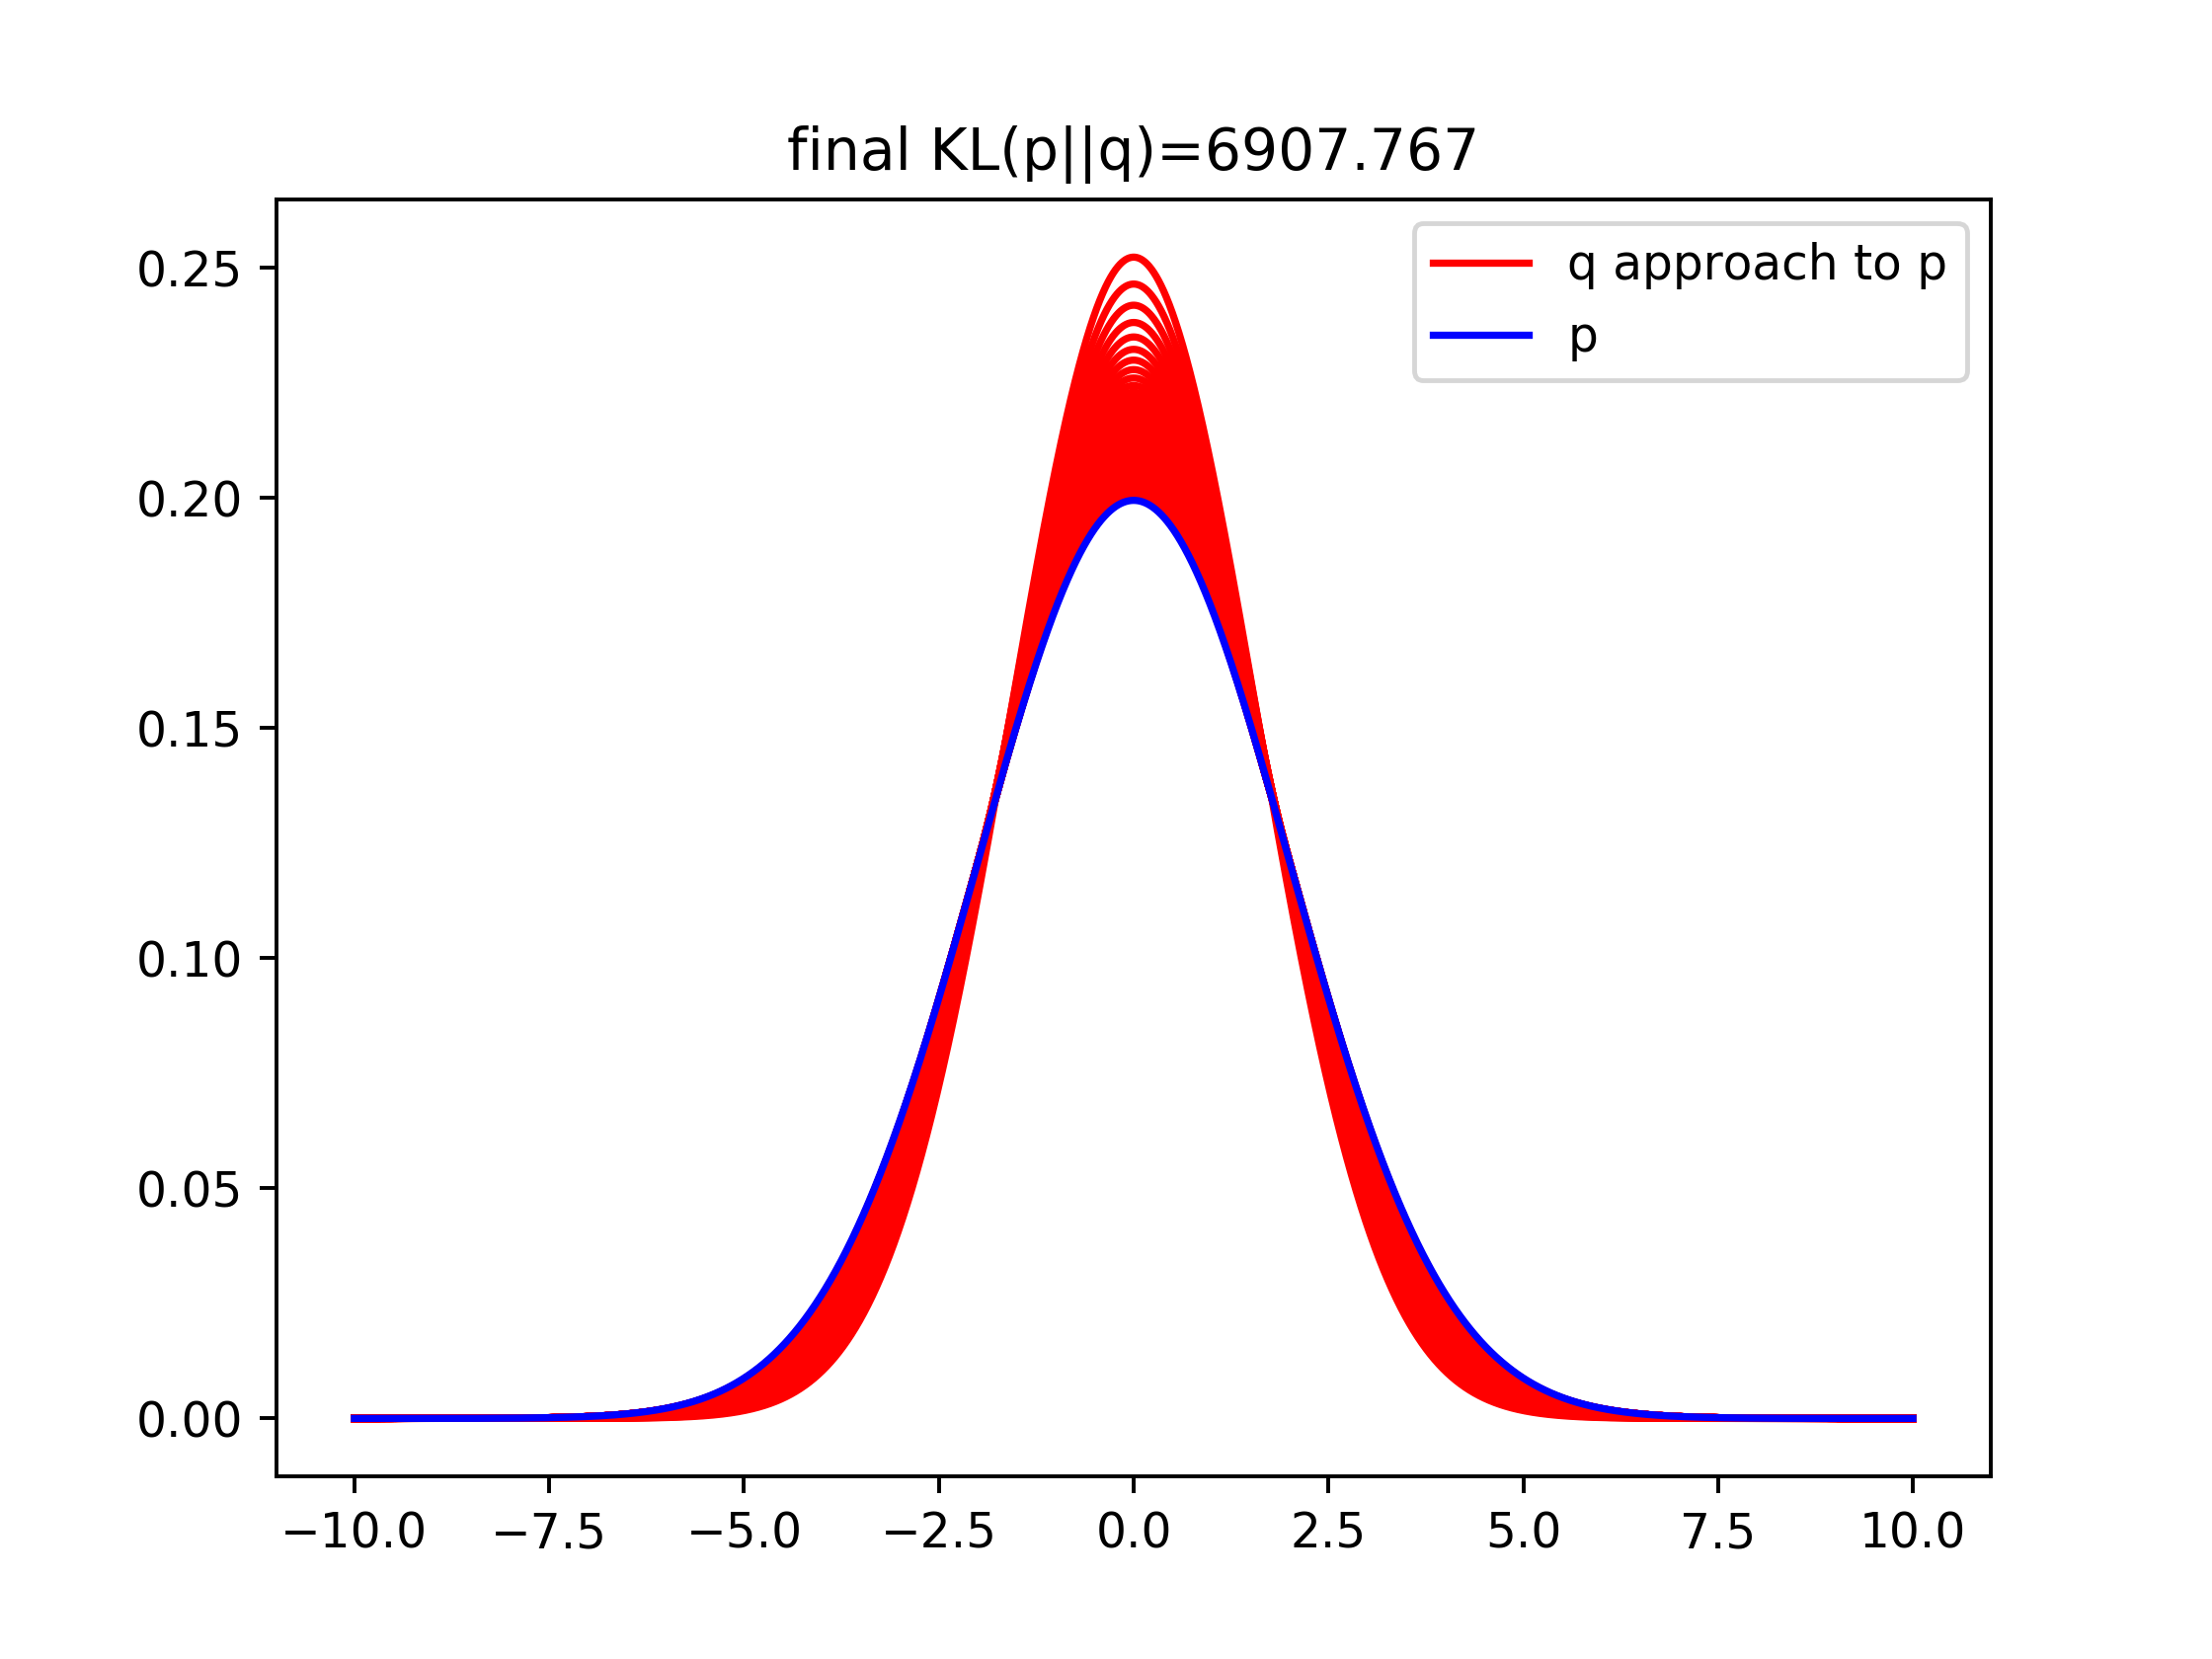
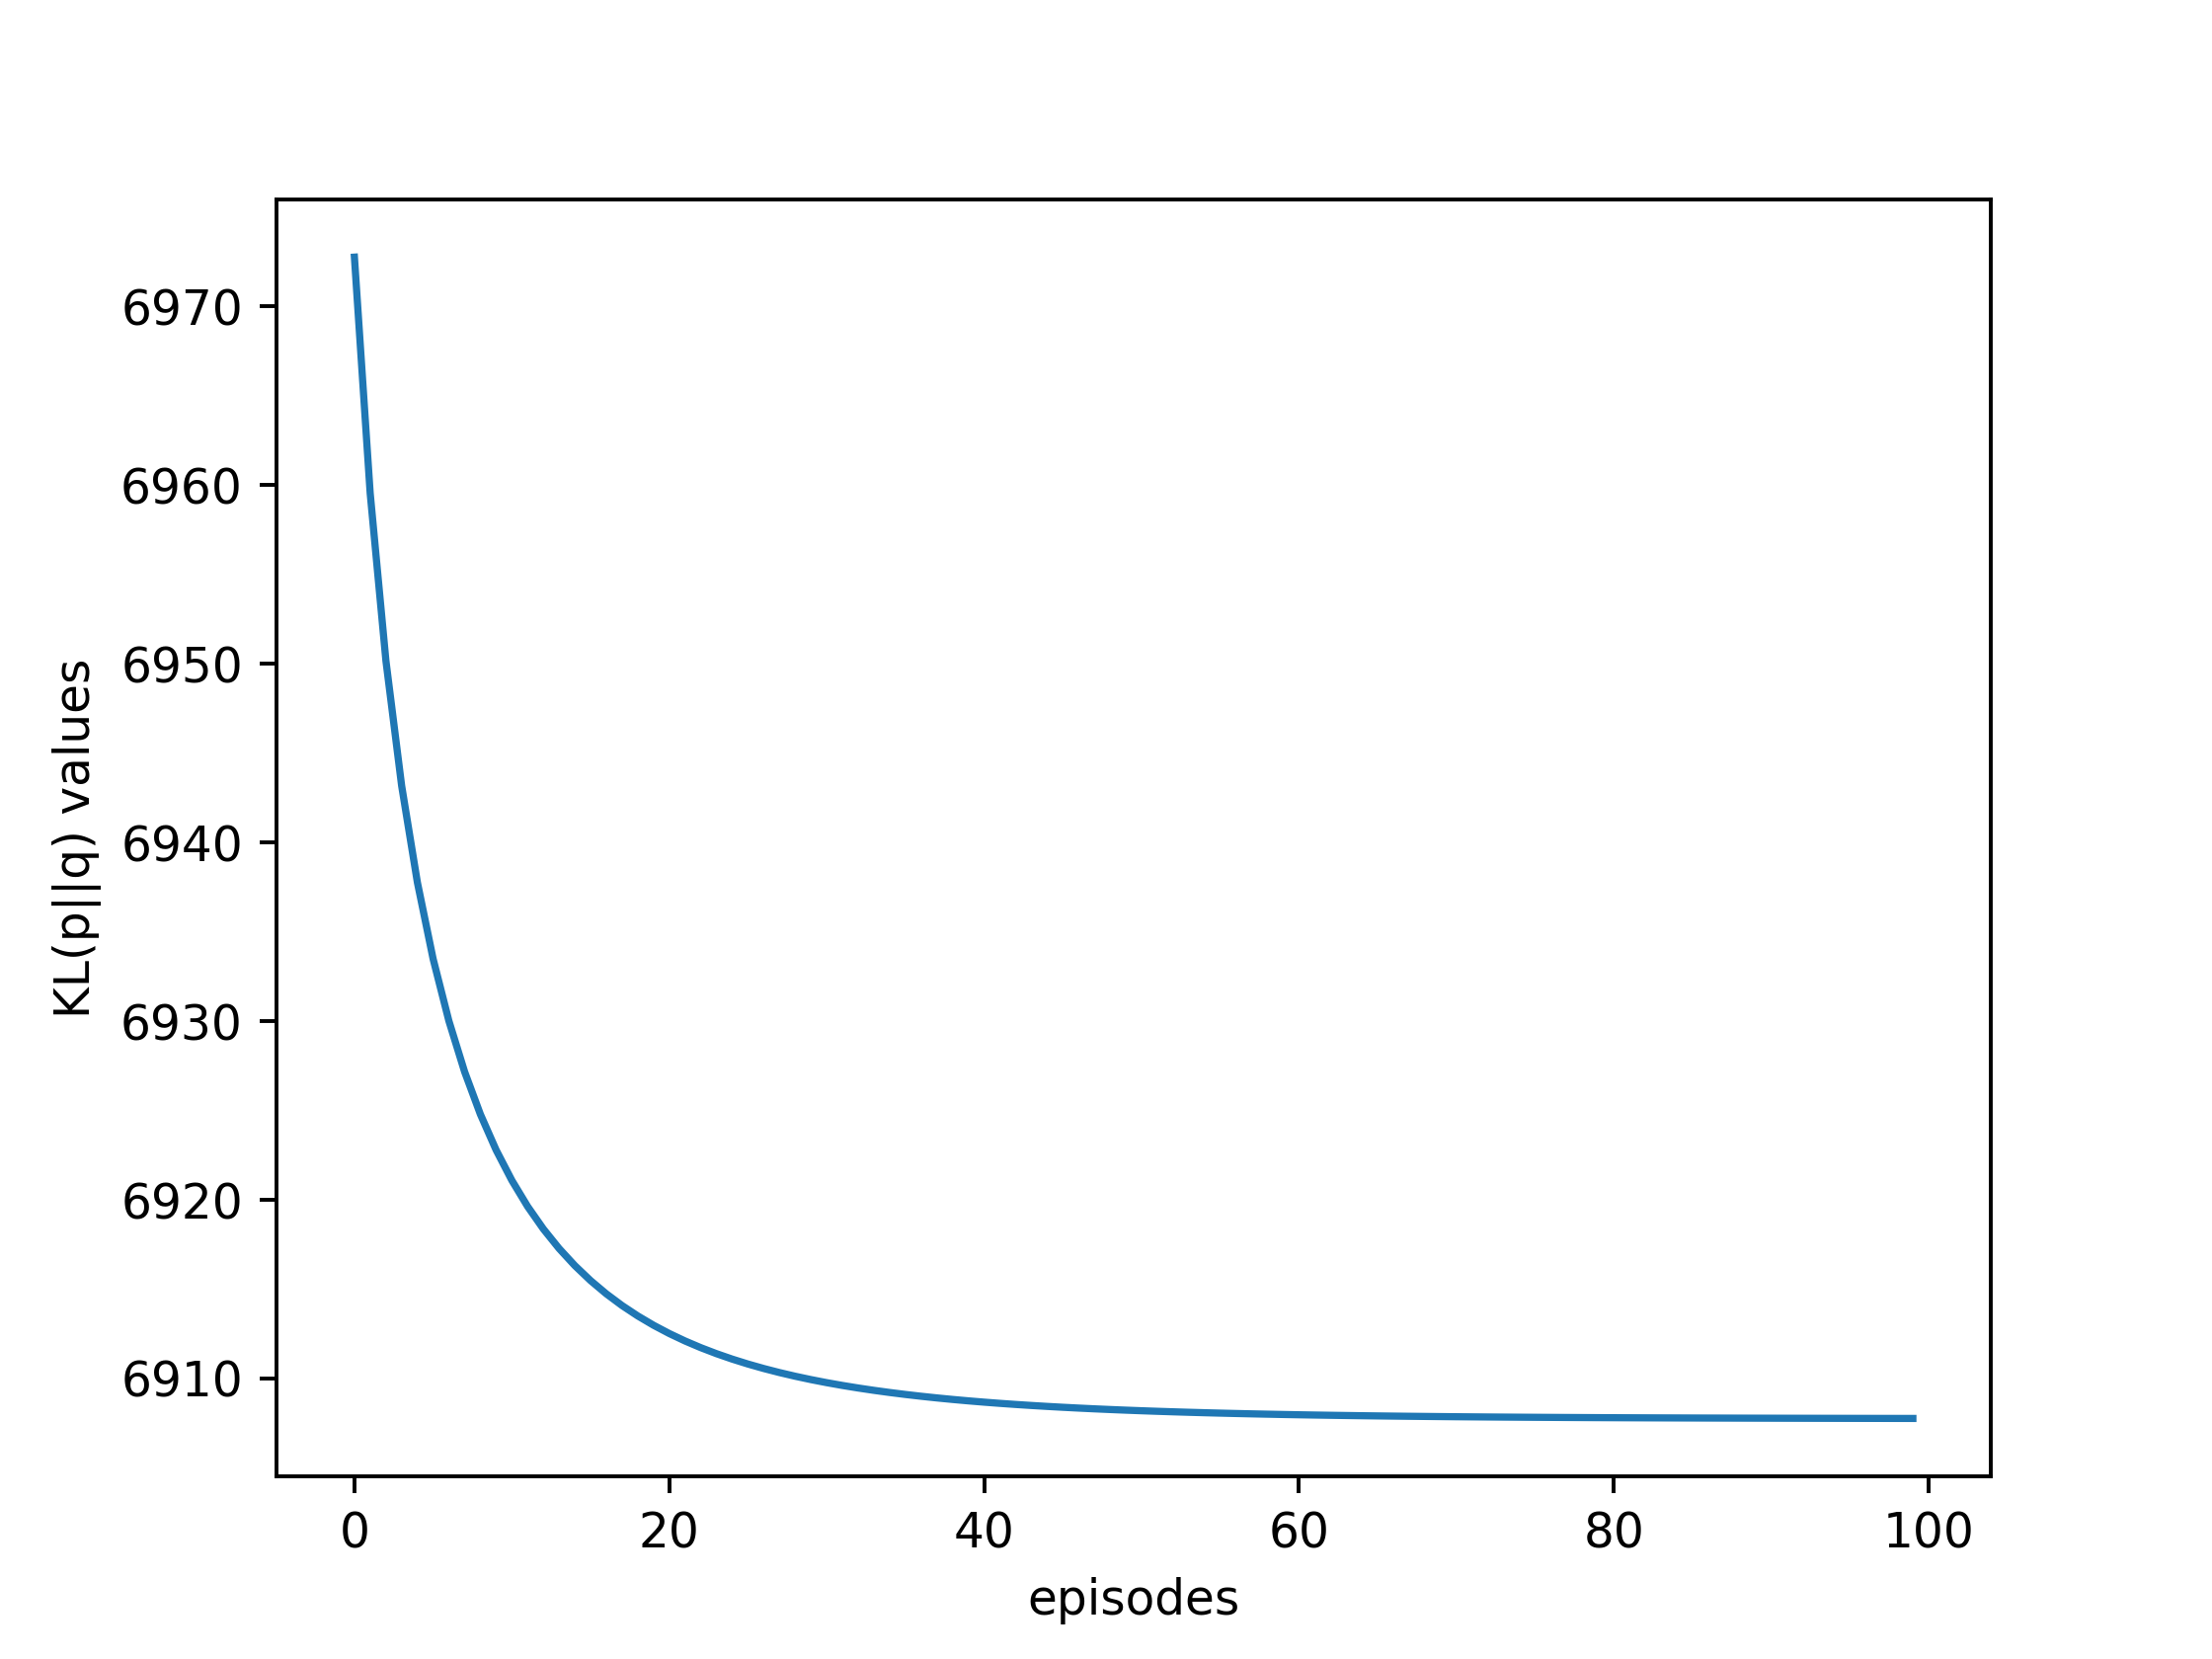
Since the lower the KL divergence, the closer the two distributions are to one another, we can estimate the Gaussian parameters for example of one distribution by minimizing its KL divergence w.r.t another
Using Gradient Descent
Create p=N(0,2), q=N(mu,sig) (mu,sig with random parameters)
x=np.arange(-10,10,0.001)
p_pdf=norm.pdf(x,0,2).reshape(1,-1) #(20000,) reshape to (1,20000)

alpha=0.001
episodes=100

#tensorflow memory relocate
p=tf.placeholder(tf.float64,shape=p_pdf.shape)
mu=tf.Variable(np.zeros(1))
sig=tf.Variable(np.eye(1))
normal=tf.exp(-tf.square(x-mu)/(2*sig))
q=normal/tf.reduce_sum(normal)

kl=tf.reduce_sum(tf.where(p==0,tf.zeros(p_pdf.shape,tf.float64),p*tf.log(p/q)))
optimizer=tf.train.GradientDescentOptimizer(alpha).minimize(kl)
init=tf.global_variables_initializer()

with tf.Session() as sess:
    sess.run(init)
    traj=[]
    mus=[]
    sig2s=[]

    for ep in range(episodes):
        sess.run(optimizer,{p:p_pdf})
        traj.append(sess.run(kl,{p:p_pdf}))
        mus.append(sess.run(mu)[0])
        sig2s.append(sess.run(sig)[0][0])

    for m,s in zip(mus,sig2s):
        q_pdf=norm.pdf(x,m,np.sqrt(s))
        plt.plot(x,q_pdf.reshape(-1,1),'r')

plt.plot(x,q_pdf.reshape(-1,1),'r',label='q approach to p')
plt.title('final KL(p||q)=%1.3f' % traj[-1])
plt.plot(x,p_pdf.reshape(-1,1),'b',label='p')
plt.legend()
plt.savefig('kl_gd.png',dpi=350)
plt.clf()
plt.plot(traj)
plt.xlabel('episodes')
plt.ylabel('KL(p||q) values')
plt.savefig('kl_klvalue.png',dpi=350)
plt.clf()
Extensions
- MaxEnt RL
- Variational inference
Reference
KL Divergence Python Example
wiki
Entropy and KL
KL Divergence for Machine Learning
