Dimension Reduction
PCA
PCA can be defined as the orthogonal projection of the data onto a lower dimensional linear space, known as the principal subspace, such that the variance of the projected data is maximized.
PCA can also be defined as the linear projection that minimizes the average projection cost, defined as the mean squared distance between the data points and their projections.
Maximum Variance Formulation
Consider a data set of N observations {x_n}, n=1,…,N
x_n is a Euclidean variable with dimensionality D
X = [ x_1, x_2, ..., x_N ] NxD  ->  NxM

               data dimension D      reduced dimension k
observation 1 [      x_1      ]     [     x_1_low      ]
            2 [      x_2      ]  -> [     x_2_low      ]
            3 [      x_3      ]     [     x_3_low      ]
            .
            .
            N
Goal: to project the data onto a space having dimensionality M, where M<D, while maximizing the variance of the projected data (suppose M is given)
Example, consider the projection onto a 1-D space (M=1)
We can define the direction of this space using D-dim vector u1, note u1 is a unit vector u1’u1=1
Each data point x_n is projected onto a scalar u1’x_n : 1xDxDx1
The mean of the projected data is u1’m
m = 1/N Σ_N x_n

m - Nx1
The variance of the projected data is u1’Su1
1/N Σ_N (u1'x_n - u1'm)^2 = u1'Su1

S = 1/N Σ_N (x_n-m)(x_n-m)'
Then we max the projected variance
max u1'Su1 w.r.t u1
constrained to u1'u1=1
To enforce the constraint, we introduce a Lagrange multiplier λ1
u1'Su1 + λ1(1-u1'u1)
By setting the derivative w.r.t u1 equal to zero, we see the quantity will have a stationary point when
Su1 = λ1u1

u1 must be an eigenvector of S

u1'Su1 = λ1
Therefore, the variance will be a maximum when we set u1 equal to the eigenvector having the largest eigenvalue λ1, the eigenvector is known as the first principal component
PCA limitation:
- if the data does not follow a multidimensional Gaussian, PCA may not give the best principal components
- if the data follows some wave-type structure, after projection, wave shape gets distorted
PCA toy example
Reduce 3D samples to 2D and 1D
Generate multivariate Gaussian data X with
mu1 = [0,0,0] and mu2 = [1,1,1]
      [1,0,0]           [1,0,0]
sig1 =[0,1,0]     sig2 =[0,1,0]
      [0,0,1]           [0,0,1]

    [x1_1, x1_2, ..., x1_20]
X1= [x2_1, x2_2, ..., x2_20]
    [x3_1, x3_2, ..., x3_20]

    [x1_1, x1_2, ..., x1_20]
X2= [x2_1, x2_2, ..., x2_20]
    [x3_1, x3_2, ..., x3_20]

X = X1 + X2
 3x40
import numpy as np
mu1=np.array([0,0,0])
sig1=np.array([[1,0,0],[0,1,0],[0,0,1]])
x1=np.random.multivariate_normal(mu1,sig1,20).T

#x1: 3x20  x1[0] first dimension, x1[1] second dimension, x1[2] third dimension

mu2=np.array([1,1,1])
sig2=np.array([[1,0,0],[0,1,0],[0,0,1]])
x2=np.random.multivariate_normal(mu2,sig2,20).T

#merge data to 3x40
x=np.concatenate((x1,x2),axis=1)

from mpl_toolkits.mplot3d import Axes3D
import matplotlib.pyplot as plt

fig=plt.figure()
ax=fig.add_subplot(111,projection='3d')
ax.plot(x1[0,:],x1[1,:],x1[2,:],'o',color='r',label='x1')
ax.plot(x2[0,:],x2[1,:],x2[2,:],'o',color='b',label='x2')
ax.legend()

Compute the observation mean
m = 1/N Σ_N x_i
N = 40
#3x1
m=np.mean(x,axis=1)

>>m
array([0.3019378 , 0.58810653, 0.74258542])
Compute the scatter matrix
S = Σ_N (x_i-m)(x_i-m)'

[x1_i - m0]        [x1_i - m0].T
[x2_i - m1]  .dot  [x2_i - m1]
[x3_i - m2]        [x3_i - m2]

i = 1~40
N = 40
s=np.zeros((3,3))
for i in range(x.shape[1]):
    s+=(x[:,i].reshape(3,1)-m.reshape(3,1)).dot((x[:,i].reshape(3,1)-m.reshape(3,1)).T)

>>s
array([[45.54147306, 13.25957003,  4.34813046],
       [13.25957003, 61.72462824, 17.32890804],
       [ 4.34813046, 17.32890804, 68.53181199]])
Compute the Covariance Matrix (alternatively to the scatter matrix)
Similar with S but using the scaling factor 1/(N-1)
cov=np.cov([x[0,:],x[1,:],x[2,:]])

>>cov
array([[1.16773008, 0.33998898, 0.11149052],
       [0.33998898, 1.58268278, 0.44433098],
       [0.11149052, 0.44433098, 1.75722595]])

>>cov*39
array([[45.54147306, 13.25957003,  4.34813046],
       [13.25957003, 61.72462824, 17.32890804],
       [ 4.34813046, 17.32890804, 68.53181199]])
Compute eigenvectors and corresponding eigenvalues
check eigen vector for S and cov are the same
eig_val,eig_vec=np.linalg.eig(s)

>>eig_val
array([86.31710459, 37.10687219, 52.37393651])

>>eig_vec
array([[-0.28648657, -0.79372883, -0.53658175],
       [-0.65026563,  0.57239385, -0.49951966],
       [-0.70361925, -0.205815  ,  0.68011773]])

eig_val_,eig_vec_=np.linalg.eig(cov)

>>eig_val_
array([2.21325909, 0.95145826, 1.34292145])

>>eig_vec_
array([[-0.28648657, -0.79372883, -0.53658175],
       [-0.65026563,  0.57239385, -0.49951966],
       [-0.70361925, -0.205815  ,  0.68011773]])
Check the calculation:
Σv=λv

Σ - cov matrix
v - eigenvector
λ - eigenvalue
eigv0=eig_vec[:,0].reshape(3,1)
eigv1=eig_vec[:,1].reshape(3,1)
eigv2=eig_vec[:,2].reshape(3,1)

>>s.dot(eigv0)
array([[-24.72869154],
       [-56.12904639],
       [-60.73437668]])

>>eig_val[0] * eigv0
array([[-24.72869154],
       [-56.12904639],
       [-60.73437668]])

>>s.dot(eigv1)
array([[-29.45279443],
       [ 21.23974555],
       [ -7.63715082]])

>>eig_val[1] * eigv1
array([[-29.45279443],
       [ 21.23974555],
       [ -7.63715082]])

>>s.dot(eigv2)
array([[-28.10289876],
       [-26.16181078],
       [ 35.62044305]])

>>eig_val[2] * eigv2
array([[-28.10289876],
       [-26.16181078],
       [ 35.62044305]])
Visualize EigenVector
from matplotlib import pyplot as plt
from mpl_toolkits.mplot3d import Axes3D
from mpl_toolkits.mplot3d import proj3d
from matplotlib.patches import FancyArrowPatch

class Arrow3D(FancyArrowPatch):
    def __init__(self, xs, ys, zs, *args, **kwargs):
        FancyArrowPatch.__init__(self, (0,0), (0,0), *args, **kwargs)
        self._verts3d = xs, ys, zs

    def draw(self, renderer):
        xs3d, ys3d, zs3d = self._verts3d
        xs, ys, zs = proj3d.proj_transform(xs3d, ys3d, zs3d, renderer.M)
        self.set_positions((xs[0],ys[0]),(xs[1],ys[1]))
        FancyArrowPatch.draw(self, renderer)

fig=plt.figure()
ax=fig.add_subplot(111, projection='3d')
ax.plot(x[0,:],x[1,:],x[2,:],'o',color='g')
ax.plot([m[0]],[m[1]],[m[2]],'o',color='r')
for v in eig_vec.T:
    a = Arrow3D([m[0],v[0]],[m[1],v[1]],[m[2],v[2]],mutation_scale=20,lw=3,arrowstyle="-|>",color="r")
    ax.add_artist(a)
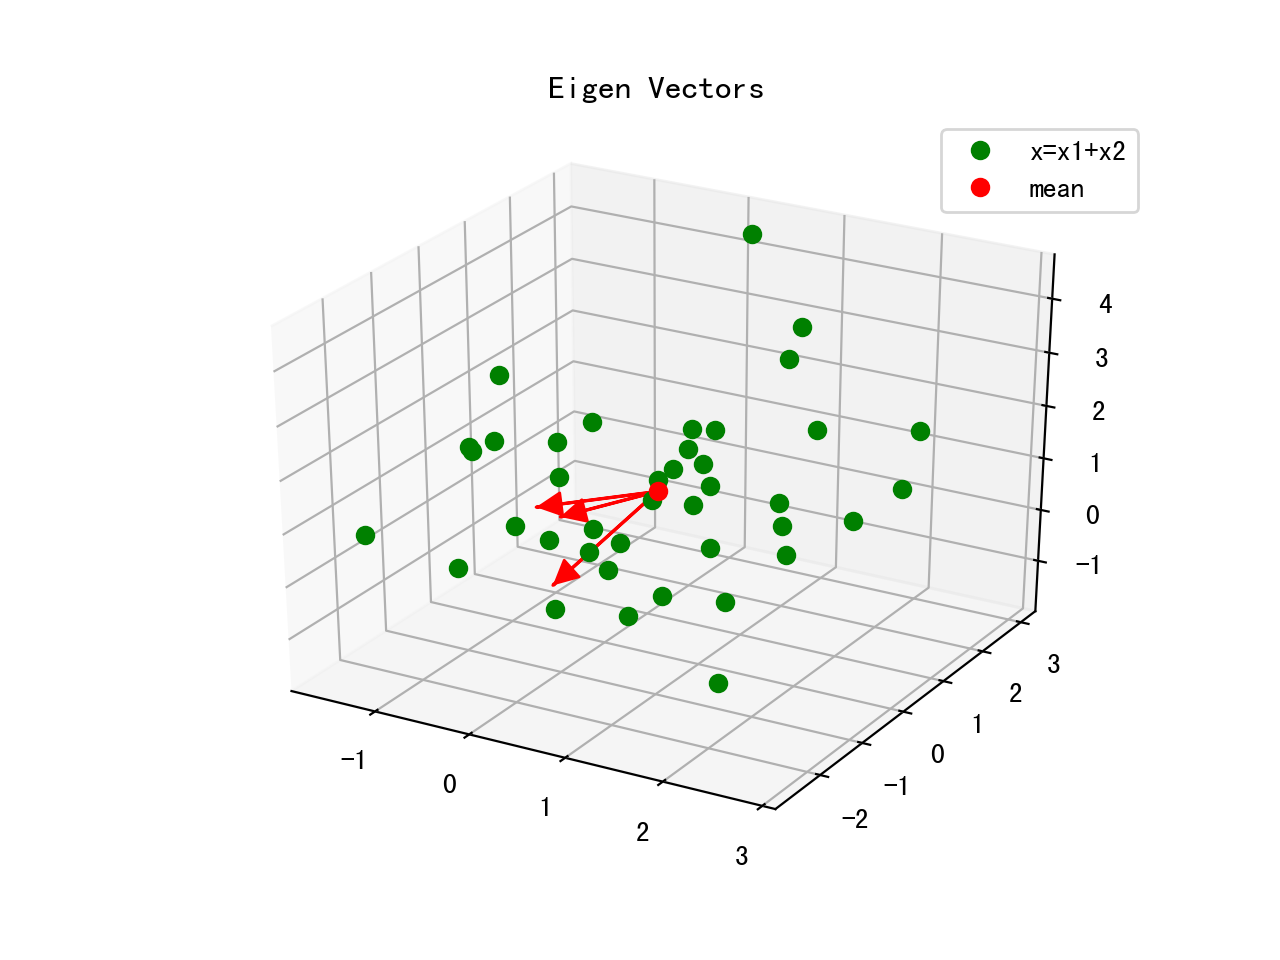
Eigenvectors only define the directions of the new axis, since they have all the same unit length 1
>>np.linalg.norm(eig_vec[0,:])
1.0

>>np.linalg.norm(eig_vec[1,:])
1.0000000000000002

>>np.linalg.norm(eig_vec[2,:])
0.9999999999999999
Sort by eigenvalues
eig=[(np.abs(eig_val[i]),eig_vec[:,i]) for i in range(len(eig_val))]
eig.sort(key=lambda x:x[0], reverse=True)

>>eig
[(86.31710458559974, array([-0.28648657, -0.65026563, -0.70361925])),
 (52.37393651019379, array([-0.53658175, -0.49951966,  0.68011773])),
 (37.10687218897268, array([-0.79372883,  0.57239385, -0.205815  ]))]
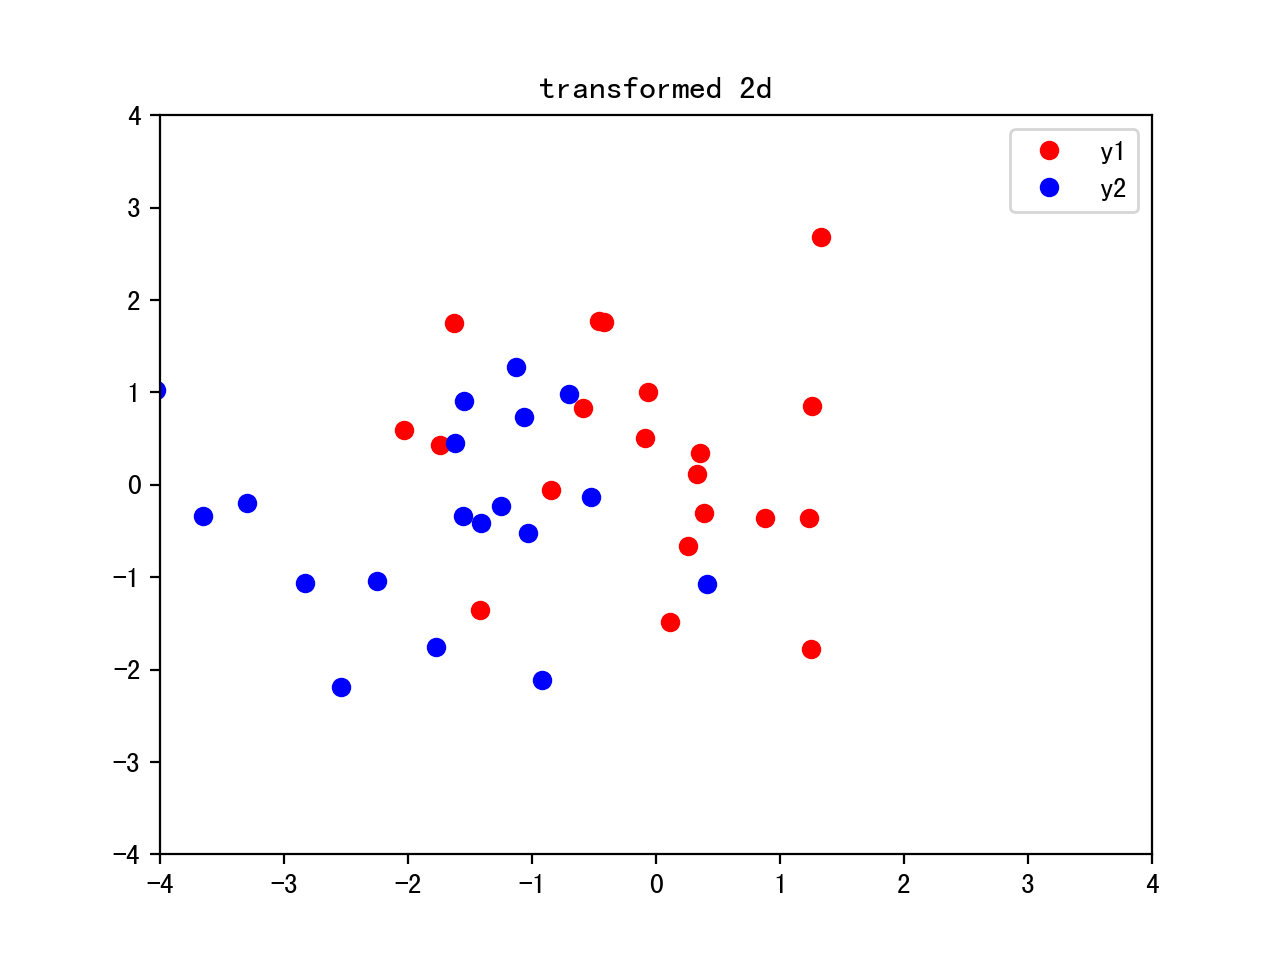
From 3D to 2D, combining the two eigenvectors with the highest eigenvalues to construct new eigenvector W:3x2
Transform the samples onto the new subspace y=w’x, 2x40<-2x3x3x40
w=np.hstack((eig[0][1].reshape(3,1),eig[1][1].reshape(3,1)))
y=w.T.dot(x)

plt.plot(y[0,0:20],y[1,0:20],'o',color='r',label='y1')
plt.plot(y[0,20:40],y[1,20:40],'o',color='b',label='y2')
plt.legend()
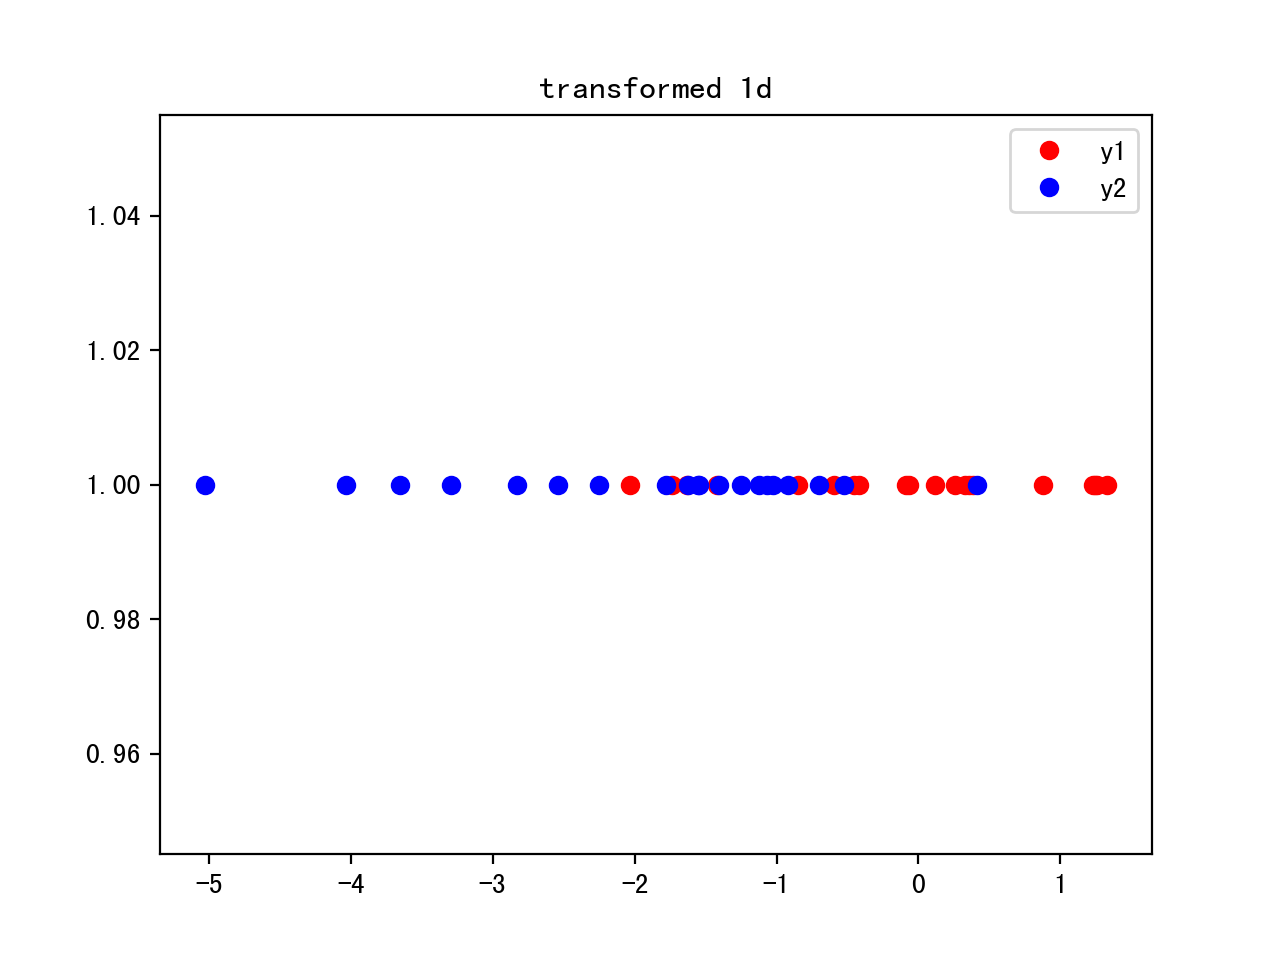
From 3D to 1D, w:3x1, y=w’x, 1x3x3x40
w=eig[0][1].reshape(3,1)
y=w.T.dot(x)

plt.plot(y[0,0:20],20*[1],'o',color='r',label='y1')
plt.plot(y[0,20:40],20*[1],'o',color='b',label='y2')
plt.legend()
Other libs
from matplotlib.mlab import PCA as mlabPCA

mlab=mlabPCA(x.T)

plt.plot(mlab.Y[0:20,0],mlab.Y[0:20,1],'o',color='r',label='y1')
plt.plot(mlab.Y[20:40,0], mlab.Y[20:40,1],'o',color='b',label='y2')

from sklearn.decomposition import PCA as sklPCA

skl=sklPCA(n_components=2)
y=skl.fit_transform(x.T)

plt.plot(y[0:20,0],y[0:20,1],'o',color='r',label='y1')
plt.plot(y[20:40,0],y[20:40,1],'o',color='b',label='y2')
PCA for mnist
pre-process: standardize variable to mean=0, and std=1
import numpy as np
import matplotlib.pyplot as plt
from itertools import product
from sklearn.decomposition import PCA
from keras.datasets import mnist
from sklearn.utils import shuffle

#mnist=fetch_mldata("MNIST original")
(x_train, y_train), (x_test, y_test) = mnist.load_data()
x=x_train/255.
x=x.reshape(60000,784)
pca=PCA(n_components=2)
x_=pca.fit_transform(x) #output

#plt.hsv() #set colormap
plt.jet()
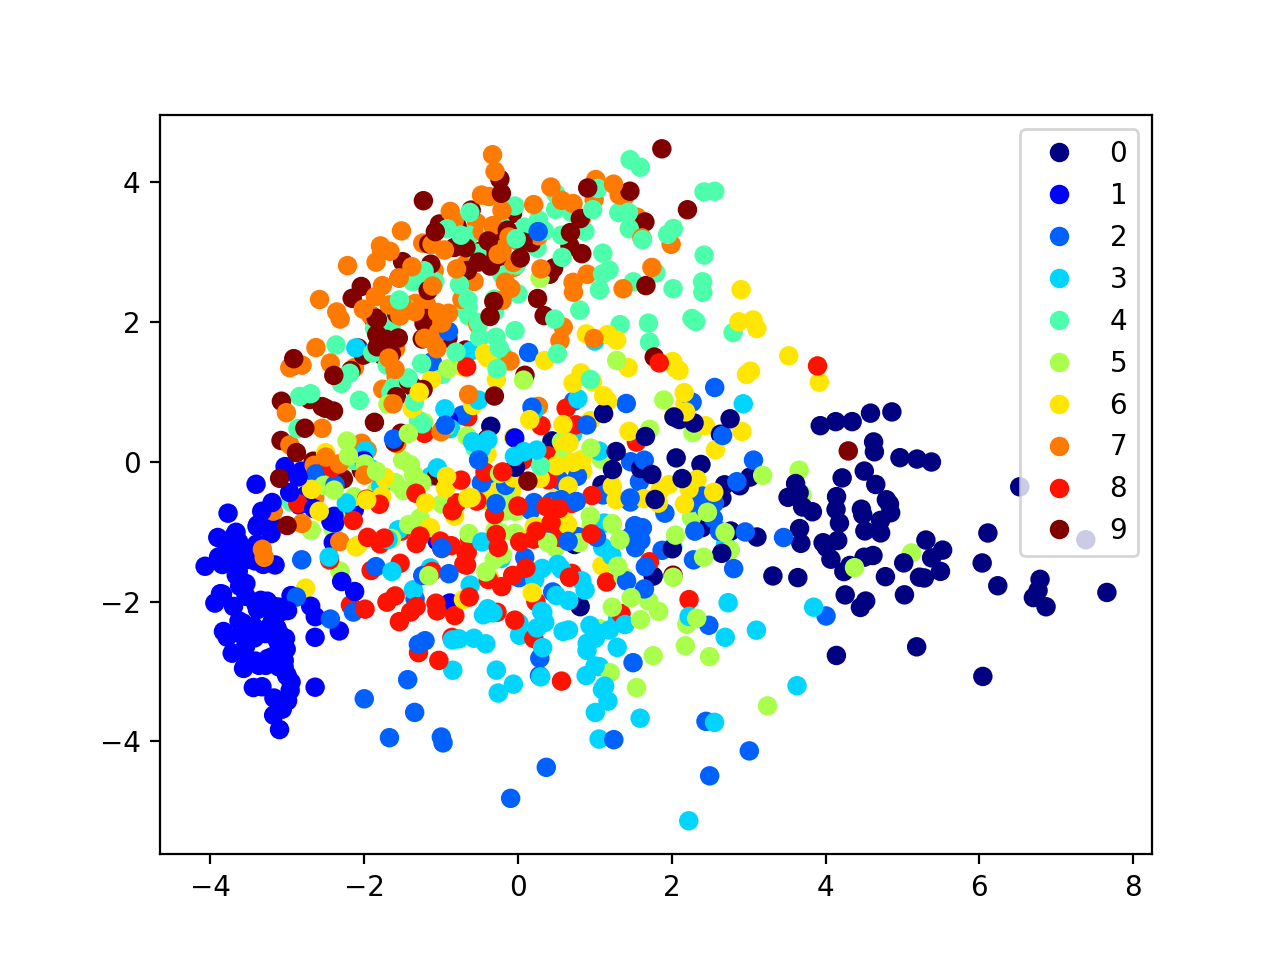
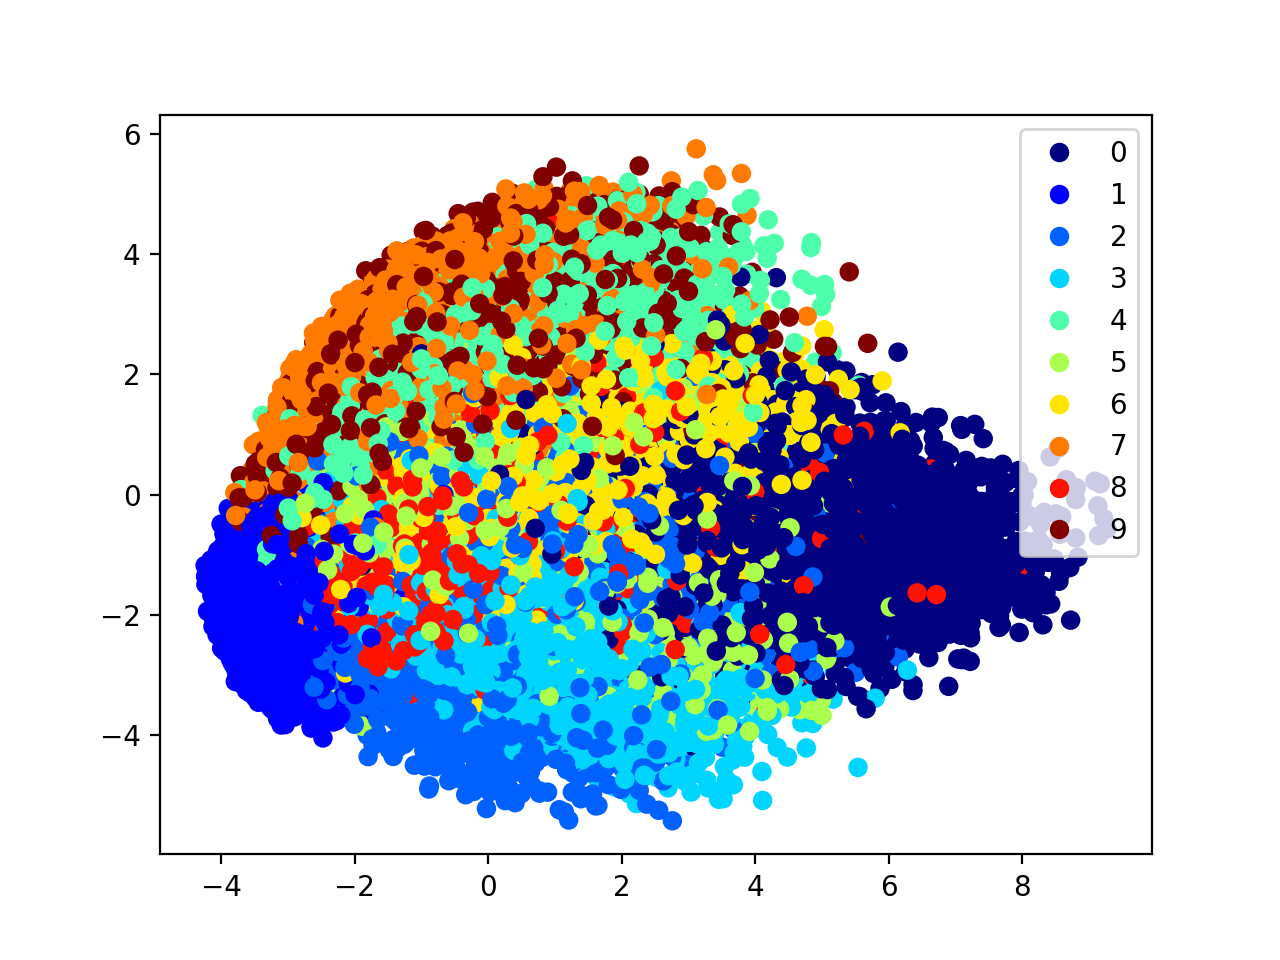
sca=plt.scatter(x_[:1000,0],x_[:1000,1],c=y_train[:1000])
plt.legend(*sca.legend_elements())
plt.show()
1000 data points and 60000 data points
