Grid RBF - SARSA, Q
RBF
RBF models the data using smooth transitioning circular shapes instead of sharp cut-off circles.
RBF enables us to be aware of the the rate of the closeness between centroids and any data point irrespective of the range of the distance.
Simple Implementation
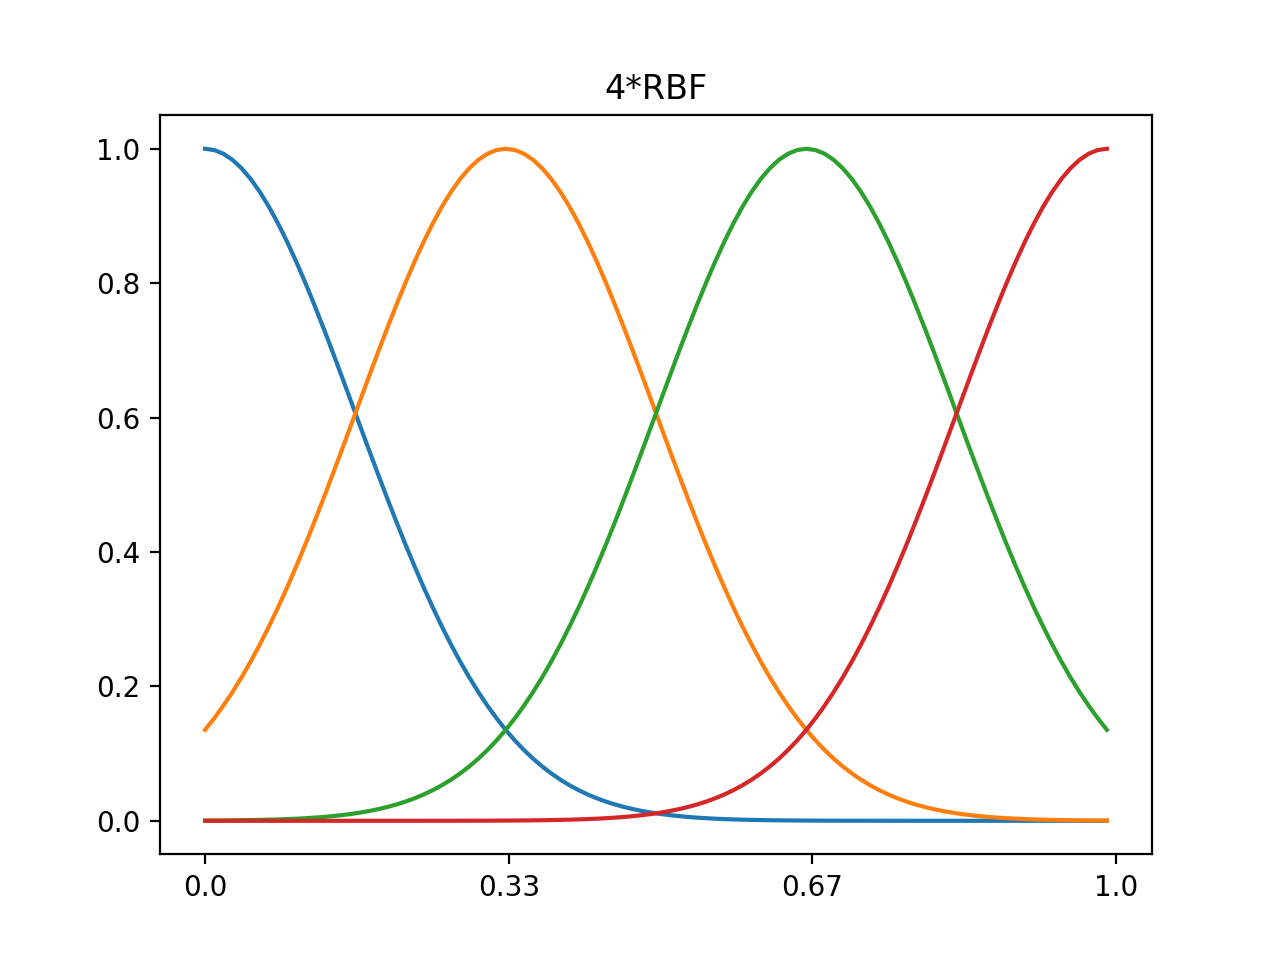
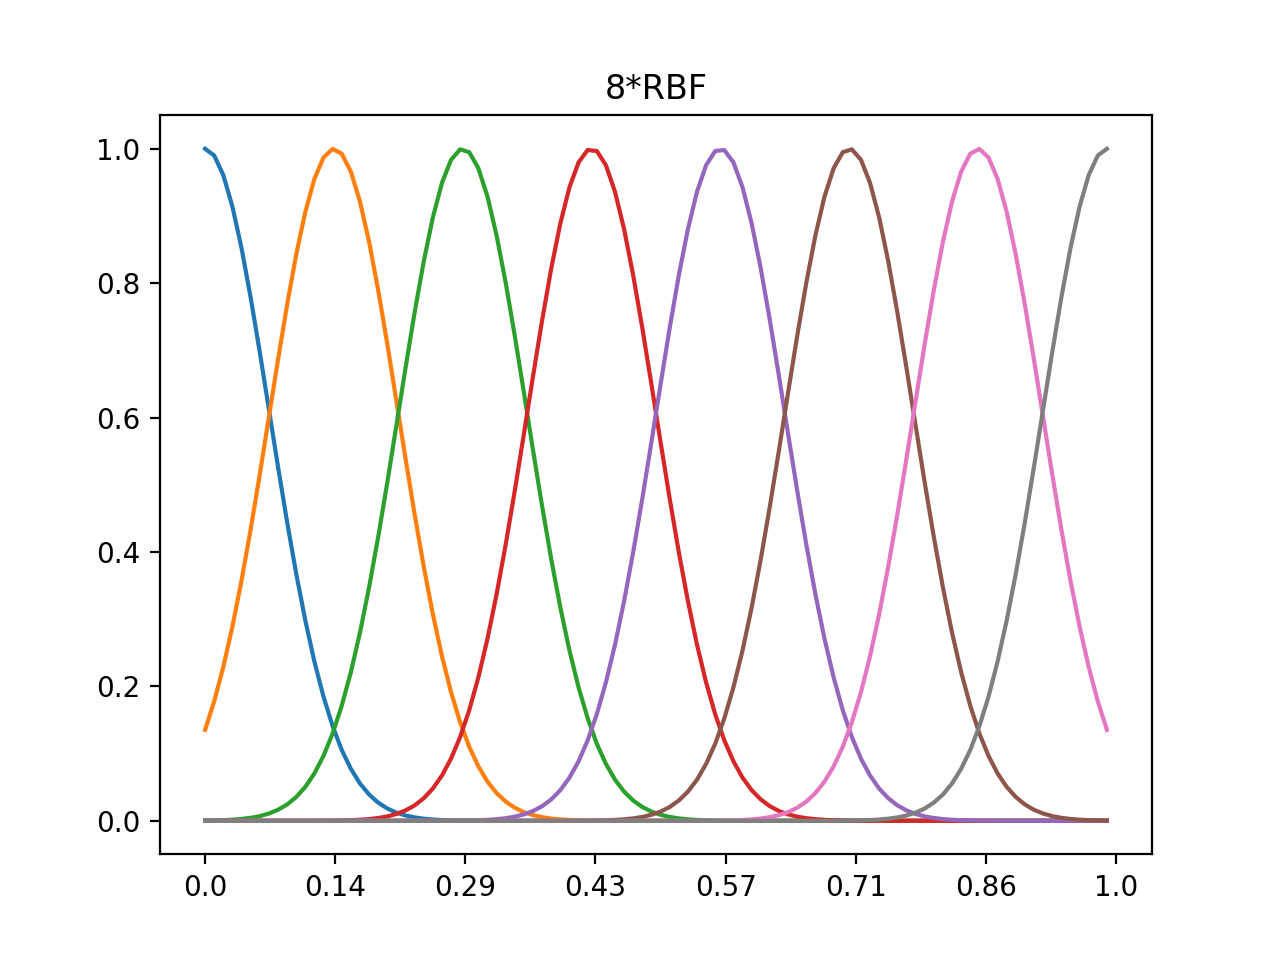
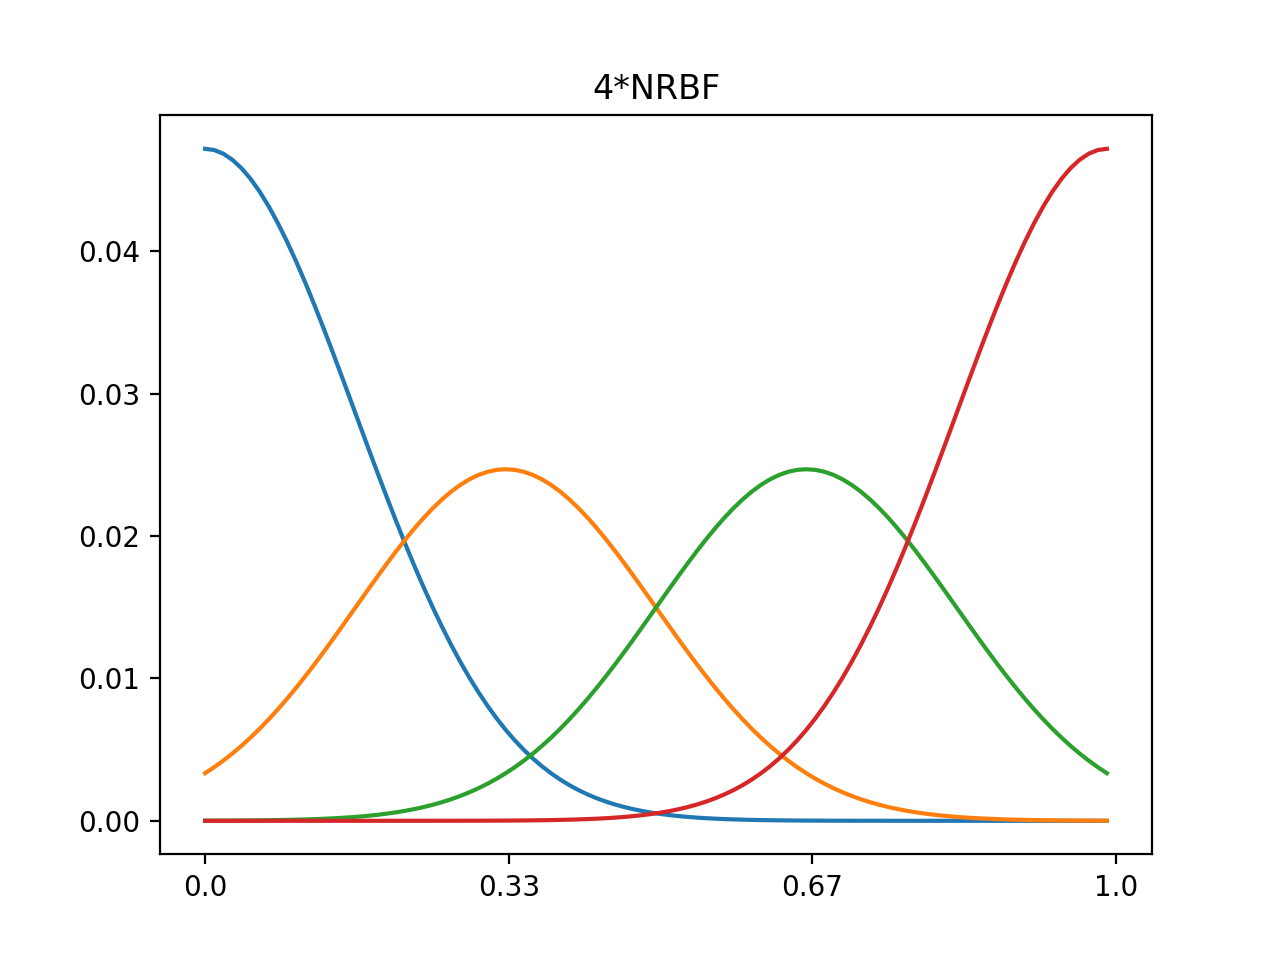
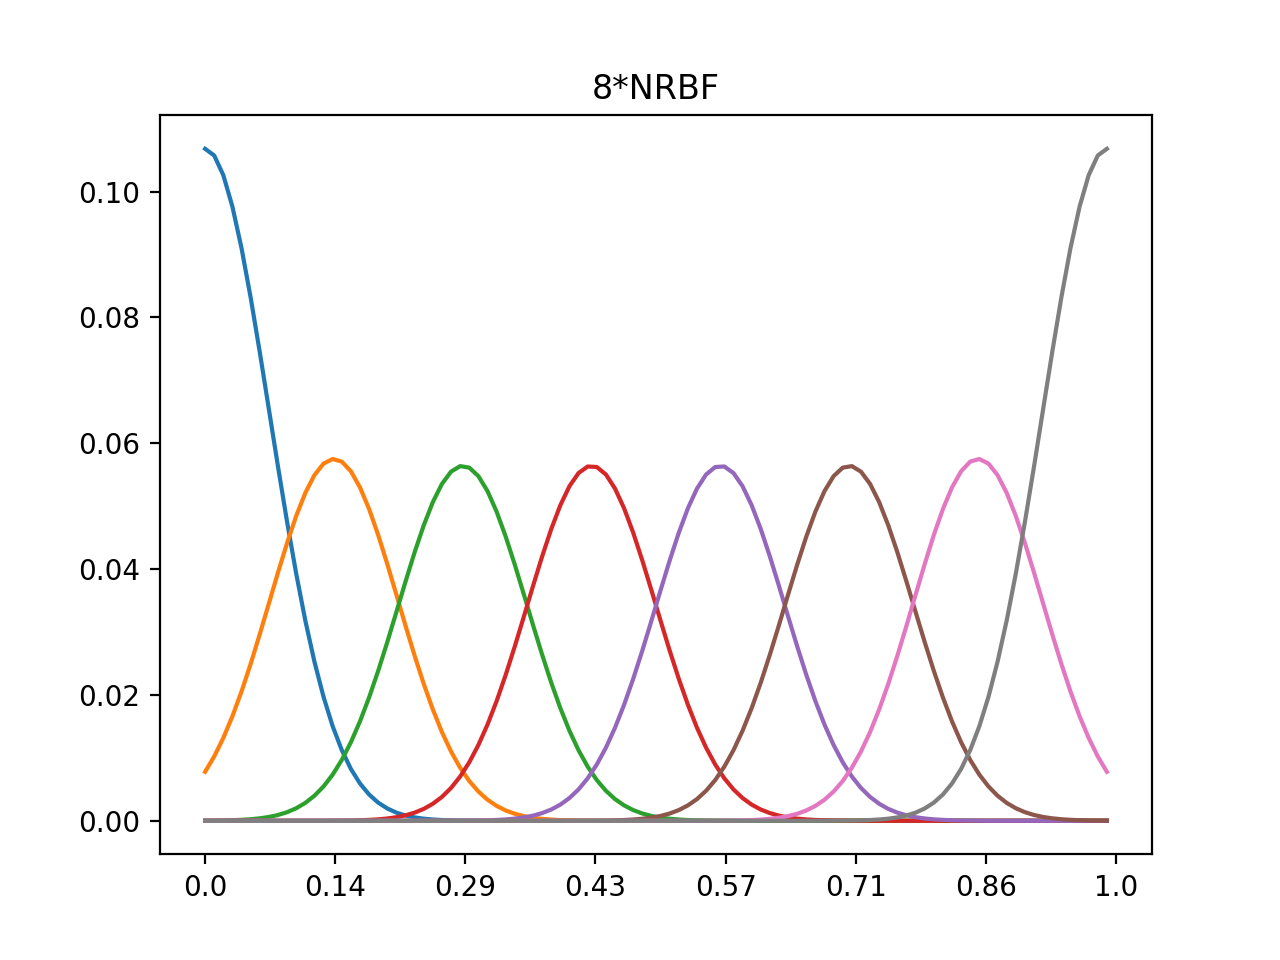
1d 4xRBF, 8xRBF, normalized center 0~1, data range 0~1
            ||s-c_i||^2
rbf = exp - -----------
              2*σ_i^2

         rbf
nrbf = -------
       Σ_c rbf
def rbf(n,nd,data):
    wid=1./(n-1) #sig=wid/2.
    den=2*(wid/2.)**2
    c=np.zeros(n)
    for i in range(n):
        c[i]=i*wid

    res=np.zeros((n,nd))

    for i in range(n):
        for j in range(nd):
            res[i,j]=np.exp(-np.linalg.norm(data[j]-c[i])**2/den)

    return res

#4*rbf
n=4 #number of rbf
nd=100 #data size
data=np.linspace(0,1,num=nd) #data range 0~1

out4=rbf(n,nd,data)
plt.plot(out4.T)
plt.xticks(np.linspace(0,100,num=n),np.around(np.linspace(0.0,1.0,num=n),decimals=2))
plt.title('4*RBF')
plt.show()

#4*nrbf
nout4=np.zeros((n,nd))
for i in range(n):
    nout4[i,:]=out4[i,:]/np.sum(out4[i,:])

plt.plot(nout4.T)
plt.xticks(np.linspace(0,100,num=n),np.around(np.linspace(0.0,1.0,num=n),decimals=2))
plt.title('4*NRBF')
plt.show()

#8*rbf
n=8
out8=rbf(n,nd,data)
plt.plot(out8.T)
plt.xticks(np.linspace(0,100,num=n),np.around(np.linspace(0.0,1.0,num=n),decimals=2))
plt.title('8*RBF')
plt.show()

#8*nrbf
nout8=np.zeros((n,nd))
for i in range(n):
    nout8[i,:]=out8[i,:]/np.sum(out8[i,:])

plt.plot(nout8.T)
plt.xticks(np.linspace(0,100,num=n),np.around(np.linspace(0.0,1.0,num=n),decimals=2))
plt.title('8*NRBF')
plt.show()
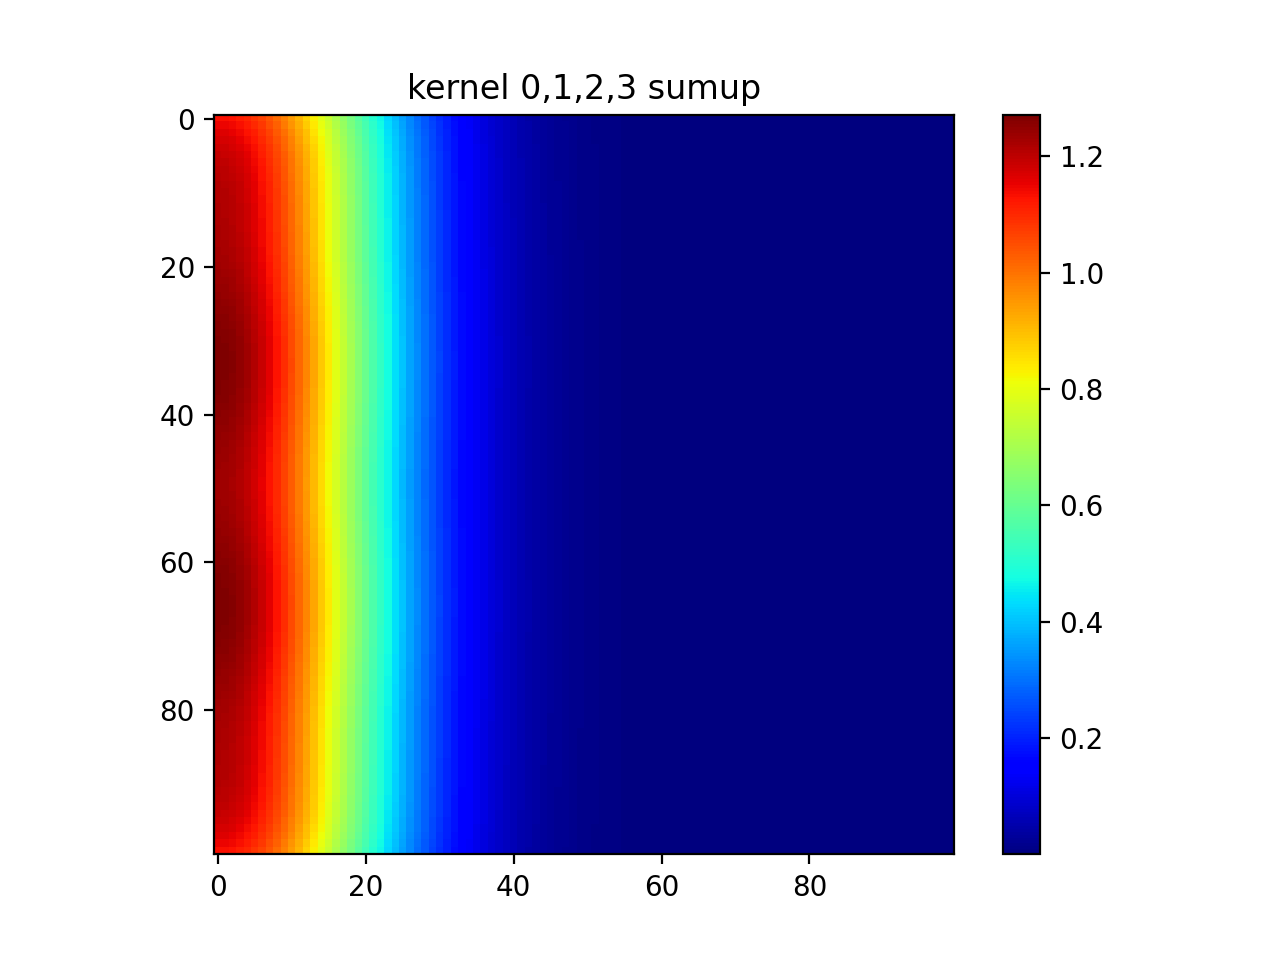
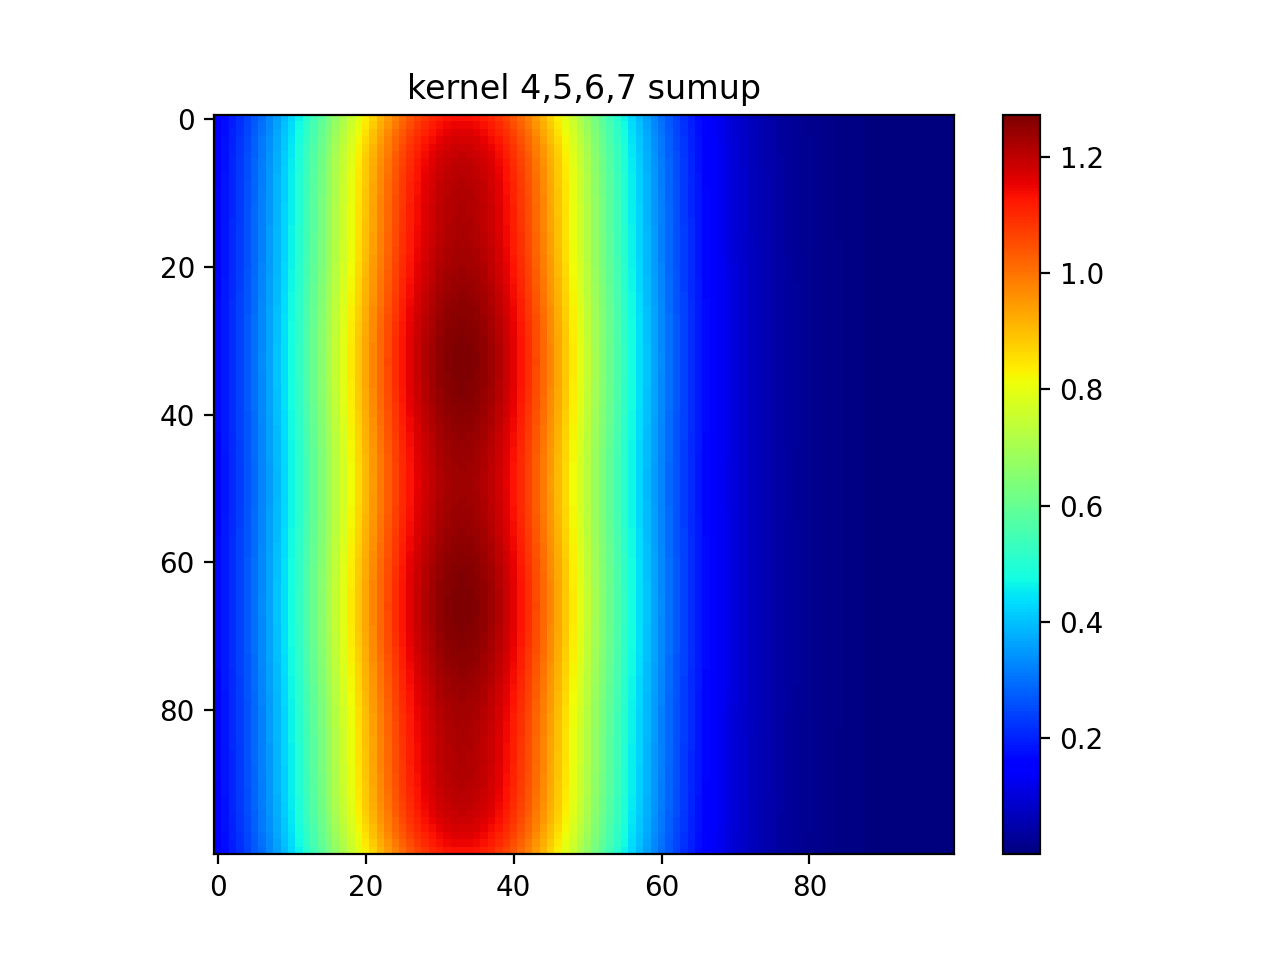
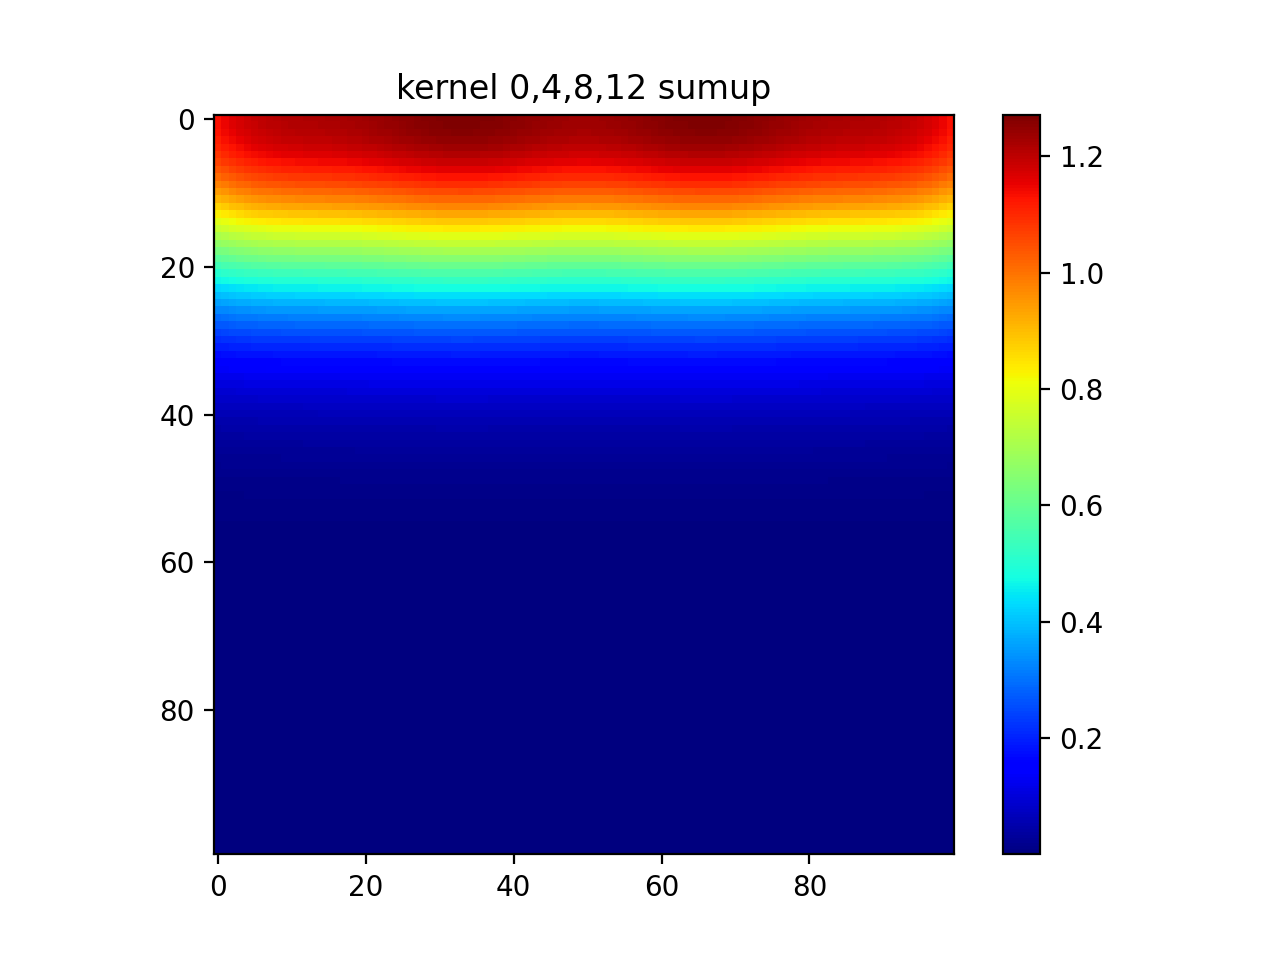
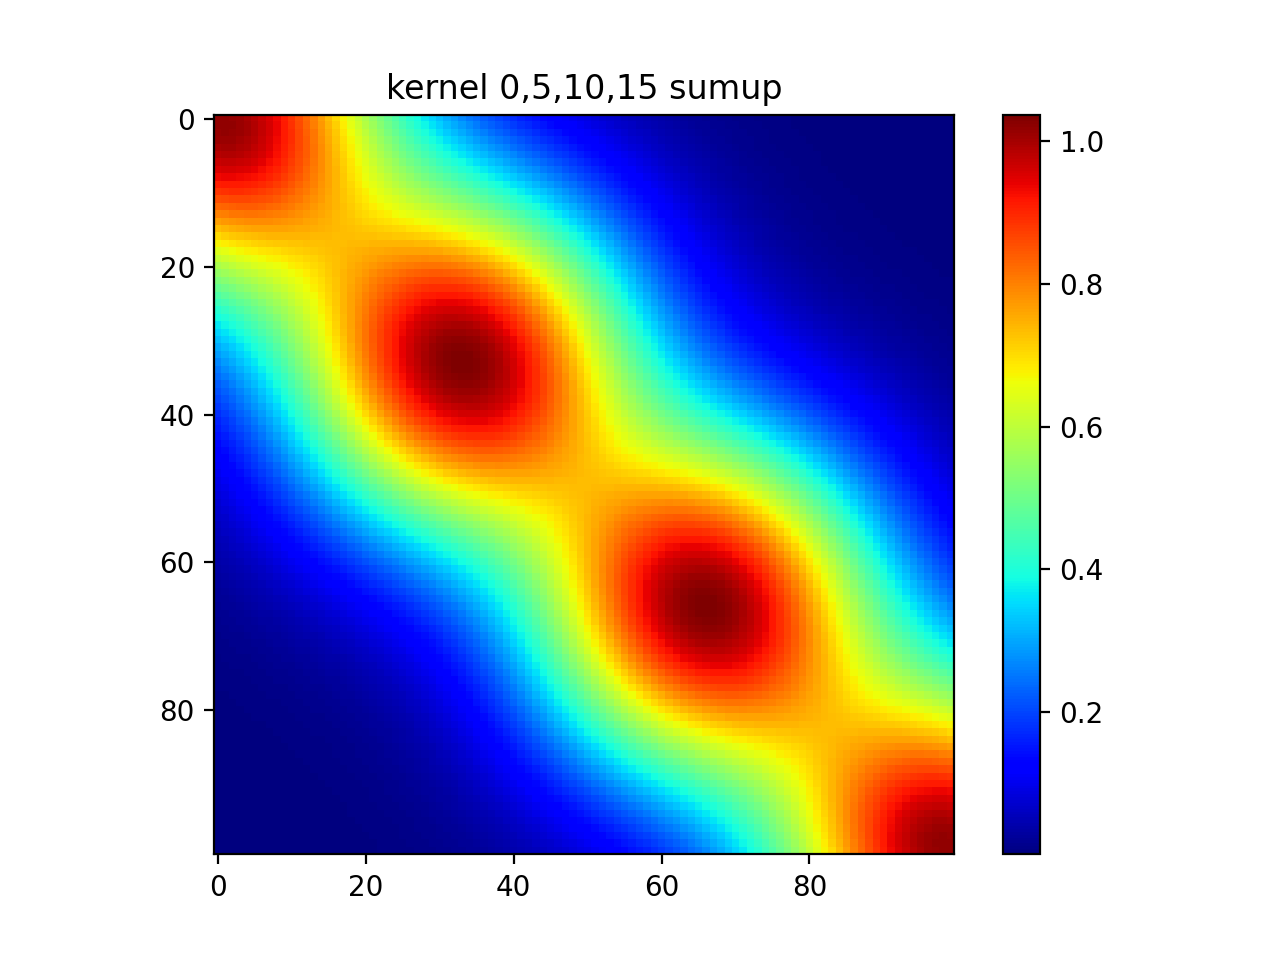
2d 4x4 RBF
def rbf_2d(n,ns,nd,data):
    wid=1./(n-1.)
    sig=wid[0]/2.
    den=2*sig**2
    c=np.zeros((np.prod(n),ns))
    for i in range(n[0]):
        for j in range(n[1]):
            c[i*n[1]+j,:]=(i*wid[1],j*wid[0])

    data_x,data_y=np.meshgrid(data,data)
    res=np.zeros((np.prod(n),nd,nd))

    for k in range(16):
        for i in range(nd):
            for j in range(nd):
                res[k,i,j]=np.exp(-np.linalg.norm([data_x[i,j]-c[k,0],data_y[i,j]-c[k,1]])**2/den)

    return res

ns=2 #2d rbf
n=4*np.ones(ns).astype(int)  #number of rbf
nd=100 #data size
data=np.linspace(0,1,num=nd)
out=rbf_2d(n,ns,nd,data)

#show diagonal
plt.imshow(out[0]+out[5]+out[10]+out[15])
plt.colorbar()

#show all
plt.imshow(np.sum(out,axis=0))
plt.colorbar()

>>c
array([[0.        , 0.        ],
       [0.        , 0.33333333],
       [0.        , 0.66666667],
       [0.        , 1.        ],
       [0.33333333, 0.        ],
       [0.33333333, 0.33333333],
       [0.33333333, 0.66666667],
       [0.33333333, 1.        ],
       [0.66666667, 0.        ],
       [0.66666667, 0.33333333],
       [0.66666667, 0.66666667],
       [0.66666667, 1.        ],
       [1.        , 0.        ],
       [1.        , 0.33333333],
       [1.        , 0.66666667],
       [1.        , 1.        ]])
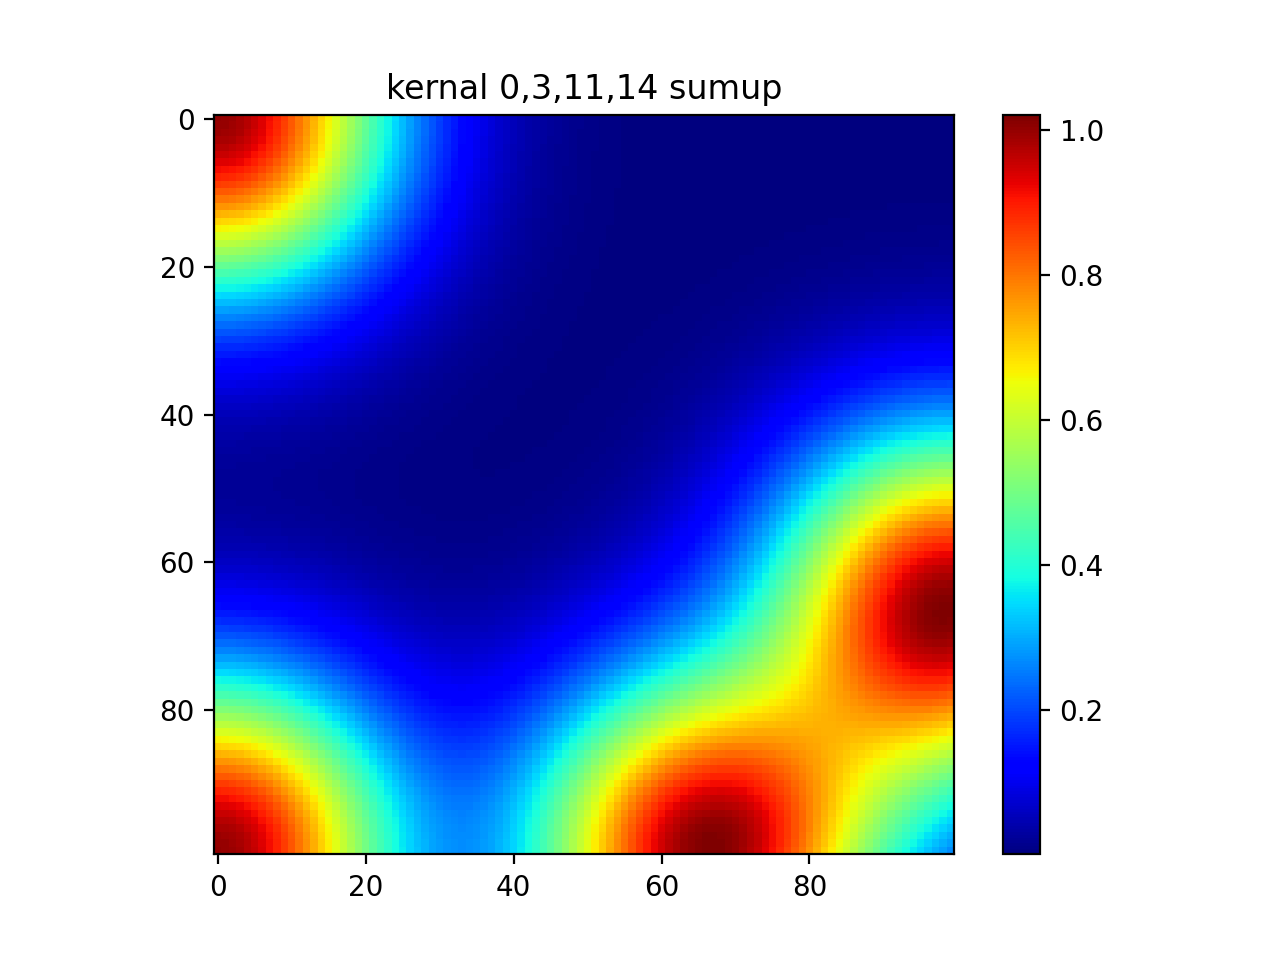
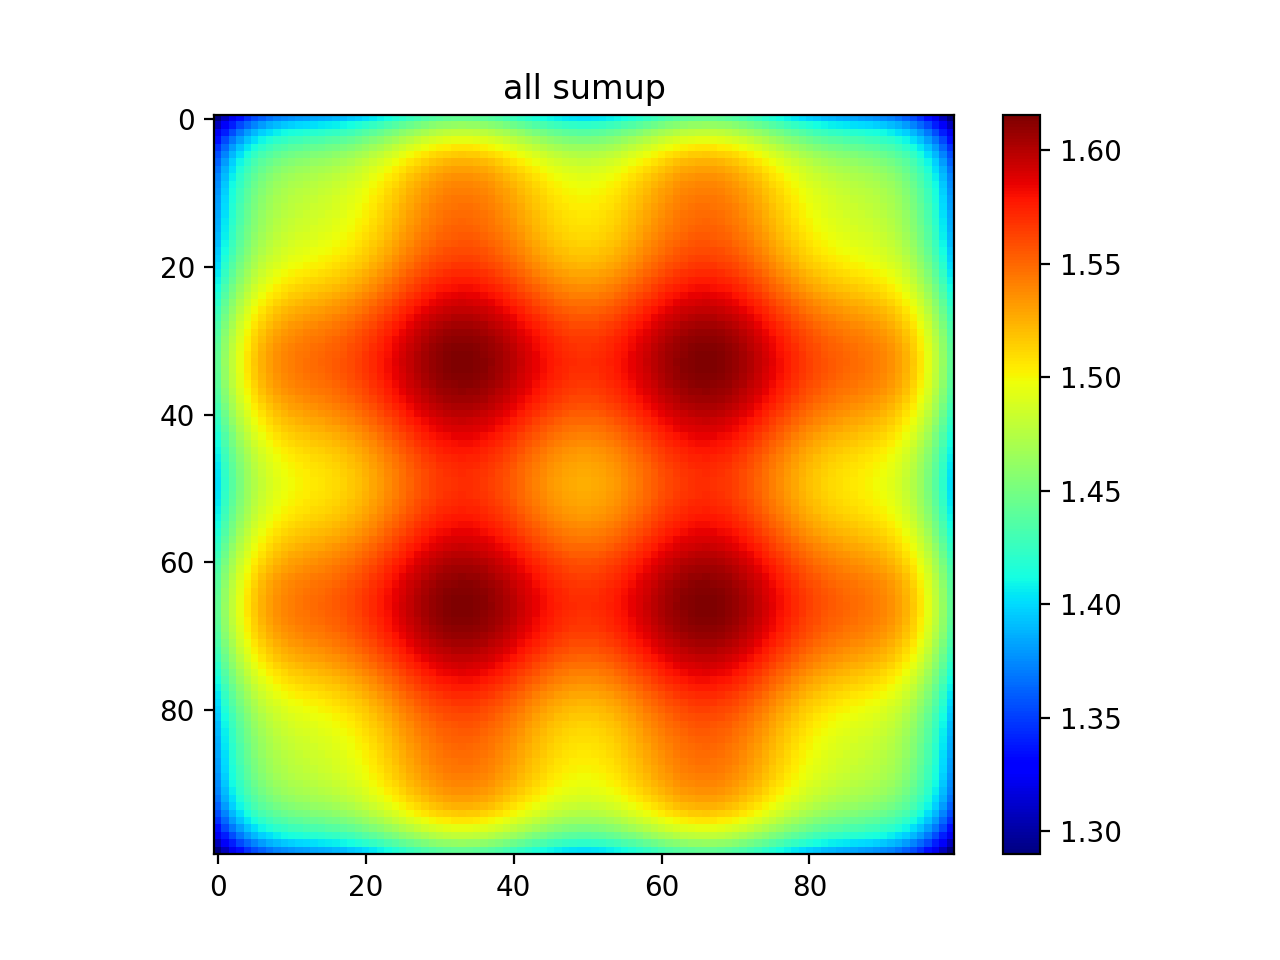
GD-SARSA(λ)
Gradient-Descent SARSA with Eligibility Traces
θ <- θ + αδe

δ = r + γQ(s',a') - Q(s,a)

e <- γλe + ∇θ Q(s,a)

e <- γλe + Φ(s)         since Q(s,a) = θ'Φ(s)
Algorithm flow:
init θ
for each episode:
    e=0
    s=env.start()
    fs=Φ(s)
    a=rand()       or  a=εgreedy(Q=θ.T*fs,ε)

    for each step:
        e(i)<-1         i in fs, fs should be 16x16 if 2d 16RBF
        #e(i)<-e(i)+1

        s',r,done=env.step(a)
        fs'=Φ(s')
        a'=εgreedy(Q'=θ.T*fs',ε)

        δ=r+γQ'(s',a')-Q(s,a)      Q(s)=θ.T*fs, Q'(s')=θ.T*fs'
        θ=θ+αδe
        e=γλe
GD-Watkin’s Q(λ)
Algorithm flow:
init θ
for each episode:
    e=0
    s=env.start()
    fs=Φ(s)

    for each step:
        e(i)<-1         i in fs, fs should be 16x16 if 2d 16RBF
        #e(i)<-e(i)+1

        a,greedy=εgreedy(Q=θ.T*fs,ε)
        s',r,done=env.step(a)
        fs'=Φ(s')

        δ=r+γmaxQ(s',a)-Q(s,a)     Q(s)=θ.T*fs, Q(s')=θ.T*fs'

        if greedy:
            e=γλe
        else:
            e=0*e

        θ=θ+αδe
Reference
Sutton 1st 8.4 Control with Function Approximation
SARSA with FA
SARSA-RBF mtcar
SARSA-RBF mtcar
SARSA lambda
RL-intro
RBF for classification
RBF for regression
